Figures & data
Figure 1. The mRNA and protein levels of CYP27A1 in bladder cancer cells.
(a, b) T24, UM-UC-3 and 5637 cell lines (2.5 × 10⁴/well) were seeded in 24-well plates and cultured for 48 h. RNA was extracted by RNAiso Plus. Expression of androgen receptor (AR) and CYP27A1 was assessed using qRT-PCR. Experiments were repeated three times, and error bars represent the standard error of the mean and *p < 0.05, **p < 0.01, ***p < 0.001 (unpaired t-test). (c)T24, UM-UC-3 and 5637 cell lines (2.5 × 10⁴/well) were seeded in 24-well plates and normally cultured for 72 h. Cell lysates were harvested for Western blotting to analyze the protein levels of AR and CYP27A1.
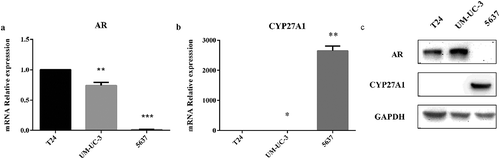
Figure 2. Cholesterol can promote the proliferation of bladder cancer cells in vitro.
T24 or 5637 cells were seeded in four 96-well plates and normally cultured for 24 h. The next day, one plate was assessed by MTT assays to confirm the cell density and cell difference between wells. The others were treated with different concentrations of LDL (0, 6.25, 12.5, 25, 50, 100 μg/ml), and cell proliferation was assessed at 24 h, 48 h and 72 h by MTT assays. Experiments were repeated three times, and error bars represent the standard error of the mean and *p < 0.05, **p < 0.01, ***p < 0.001 (2-way ANOVA).
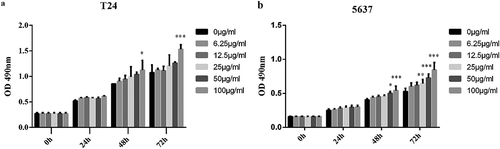
Figure 3. CYP27A1 affects intracellular 27-HC and cholesterol secretion.
(a, b) T24 or UM-UC-3 cells stably expressing CYP27A1 or the pLVX control (2.5 × 10⁴/well) were seeded in 24-well plates and cultured for 48 h and 72 h, RNA and protein were extracted by RNAiso Plus and SDS buffer respectively. mRNA levels of CYP27A1 were assessed using qRT-PCR, cell lysates were harvested and Western blotting was performed to analyze the protein levels of CYP27A1. Experiments were repeated three times, and error bars represent the standard error of the mean and **p < 0.01, ***p < 0.001 (unpaired t-test). (c, d) T24 or UM-UC-3 cells stably expressing CYP27A1 or the pLVX control (2.5 × 10⁴/well) were seeded in 6-well plates and cultured for 6 d and cell lysates were harvested. 27-HC/Cholesterol levels were measured by ELISAs and normalized to total protein. Experiments were repeated three times, error bars represent the standard error of the mean and *p < 0.05, **p < 0.01 (unpaired t-test).
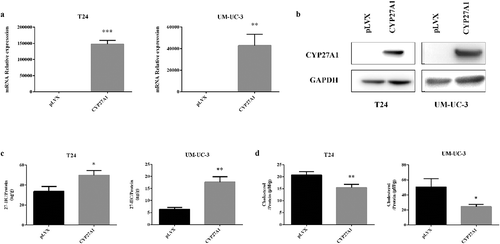
Figure 4. CYP27A1 inhibits bladder cancer cells proliferation in vitro and vivo.
T24 or UM-UC-3 cells overexpressing CYP27A1 or the pLVX control (1 × 10³/well) were seeded in 96-well plates and cell proliferation was detected by MTT assays at the indicated days. At day 0, one plate was assessed by MTT assays to confirm the cell density and cell difference between wells. Experiments were performed three times, and error bars represent the standard error of the mean and **p < 0.01, ***p < 0.001(2-way ANOVA). (b) T24 or UM-UC-3 cells overexpressing CYP27A1 or the pLVX control cells (1,000, 500 cells/well) were seeded in 6-well plates and cultured in 10% DMEM with 1 μg/ml puromycin for 2 wk. Colonies were stained with crystal violet. Experiments were performed three times. A representative well showing colony growth is also shown in the graph. Error bars represent the standard error of the mean and *p < 0.05, **p < 0.01 (unpaired t-test). Tumor volume (c) and weights (d) of CYP27A1-T24- and pLVX-T24-derived xenografts in vivo were compared. After the 25th day, CYP27A1-tumor size was significantly smaller than the control (pLVX) and *p < 0.05, ***p < 0.001(2-way ANOVA). After 30 d, all animals were sacrificed and tumors were collected (e).
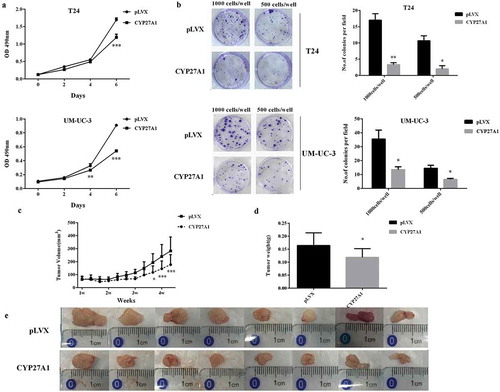
Figure 5. CYP27A1 inhibits bladder cancer cells proliferation via producing 27- HC.
T24 or UM-UC-3 cells (1 × 10³/well) were seeded in 96-well plates for 24 h and then treated with 10 µM of 27-HC or DMSO (control). Cell proliferation was detected by MTT assays at the indicated days. At day 0, one plate was assessed by MTT assays to confirm the cell density and cell difference between wells. The data shown are representative of three independent experiments. Error bars represent the standard error of the mean and **p < 0.01, ***p < 0.001 (2-way ANOVA). (b) T24 or UM-UC-3 cells (1,000, 500 cells/well) were seeded in 6-well plates for 24 h and then treated with 1 µM of 27-HC or DMSO (control) and cultured for 2 wk. Colonies were stained with crystal violet. Experiments were repeated three times. A representative well showing colony growth is also shown in the graph. Error bars represent the standard error of the mean and **p < 0.01, ***p < 0.001 (unpaired t-test).
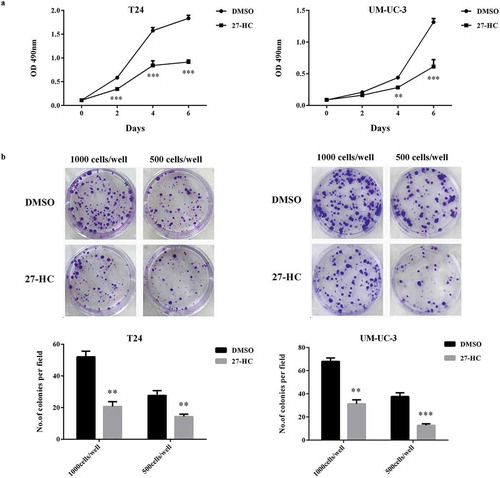
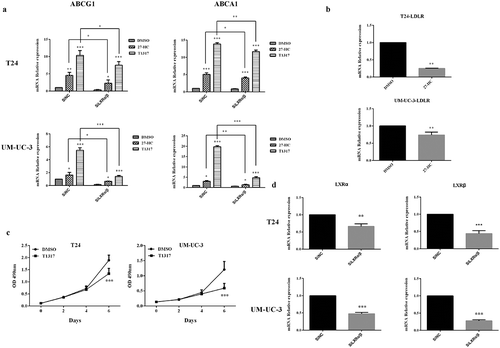
Figure 6. 27-HC inhibits bladder cancer cells proliferation by upregulating ABCG1 and ABCA1 through LXRs pathway.
(a) T24 or UM-UC-3 cells were seeded into 24-well plates at a density of 1 × 10⁴ cells/well. The next day, cells were transiently transfected with either SiNC (20 pM) or SiLXRα/β (20 pM). Two days later, the cells were treated with DMSO/27-HC (10 μM)/T1317 (10 μM) for 24 h. The expression of ABCG1, ABCA1 was assessed by qRT-PCR, *p < 0.05, **p < 0.01, ***p < 0.001 (2-way ANOVA and unpaired t-test).(b) T24/UM-UC-3 cells were seeded in 24-well plates and then treated with 10 μM of 27-HC and DMSO (control) at next day and continue cultured for 4 d, mRNA level of LDLR was assessed using qRT-PCR. Experiment were repeated three times, error bars represent the standard error of the mean and **p < 0.01 (unpaired t-test). (c) T24 or UM-UC-3 cells (1 × 10³/well) were seeded in 96-well plates for 24 h and then treated with 10 µM of T1317 or DMSO (control). Cell proliferation was detected by MTT assays at the indicated days. At day 0, one plate was assessed by MTT assays to confirm the cell density and cell difference between wells. The data shown are representative of three independent experiments. Error bars represent the standard error of the mean and ***p < 0.001 (2-way ANOVA). (d) T24 or UM-UC-3 cells were transiently transfected with SiNC (negative control) or SiLXRα/β, knockdown effects of LXRα and LXRβ were detected, **p < 0.01, ***p < 0.001 (unpaired t-test).