Figures & data
Figure 1. The expression pattern of MIAT in corneal neovascularization tissues of rat model. (a) The expression of MIAT was determined using real-time PCR; (b) The expression of miR-1246 was detected using real-time PCR; (c) The expression of AngII, AngI and ACE was measured using real-time PCR and western blot. *P < 0.05 vs control.
Figure 2. Effects of MIAT on cell proliferation and migration of HUVECs. (a) Effects of VEGF and si-MIAT on the expression of MIAT was determined using real-time PCR; (b) Effects of VEGF and si-MIAT on the expression of miR-1246 was measured using real-time PCR; (c) Effects of VEGF and si-MIAT on the expression of AngII, AngI and ACE was determined using real-time PCR and western blot; (d) Effects of VEGF and si-MIAT on the expression of cell migration and proliferation were determined using transwell assay and MTT assay, respectively. (e) The cell migration pictures under the treatments of VEGF and si-MIAT. *P < 0.05 vs control, #P < 0.05 vs si-control + VEGF.
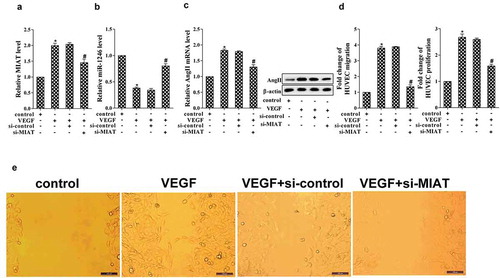
Figure 3. MIAT regulates the expression of miR-1246. (a) Online prediction found that MIAT could bind with miR-1246. (b) RIP assay revealed that MIAT and miR-1246 were accumulated in AGO2. (c) RNA pull-down revealed that MIAT pulled down the AGO2 in the compound. (d) miR-1246 was accumulated in the pull-down compound of MIAT. *P < 0.05 vs IgG, #P < 0.05 vs NC.
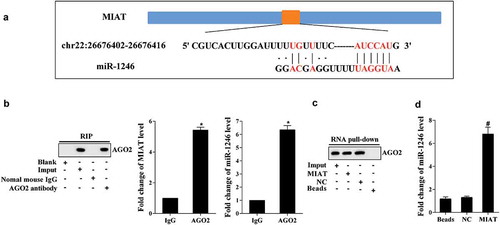
Figure 4. Effects of VEGF on the expression of ACE. (a) The expression of ACE was determined using real-time PCR and western blot; (b) The expression of AngII was determined using real-time PCR and western blot. *P < 0.05 vs control, #P < 0.05 vs si-control, &P < 0.05 vs NC.
Figure 5. Effects of VEGF, MIAT, miR-1246 and enalaprilat on cell proliferation and migration. *P < 0.05 vs control, #P < 0.05 vs si-control, &P < 0.05 vs NC, $P < 0.05 vs miR-1246 inhibitor.
Figure 6. In vivo to validate the role of si-MIAT on corneal neovascularization. (a) The lengths and areas of corneal neovascularization on day 3, 5 and 7 after operation. (b) The expression of MIAT and miR-1246 was determined using real-time PCR, the expression of AngII was determined using western blot. *P < 0.05 vs si-control.