Figures & data
Table 1. Relationship between circ-BIRC6 expression and clinicopathological factors
Figure 1. circ-B1RC6 is upregulated in HCC. (a) Heat map showing differently expressed circRNAs in three pairs of HCC and normal tissues based on high-throughput sequencing analysis. N, normal tissue; T, tumor tissue. (b) Relative expression of circ-BI RC6 in 55 pairs of HCC and normal tissue, as determined by qRT-PCR. (c) Relative expression of circ-BIRC6 in HCC tissues of different TNM stages. (d) Relative expression of circ-BI.RC6 in HCC tissue with and without vascular invasion, as determined by qRT-PCR. (e) Relative expression of circ-BIRC6 in HCC cell lines (HepG2, SMMC7721, Bel7402, and Huh7 cells) compared to normal (L02) cells, as determined by qRT-PCR. (f) Kaplan-Meier survival curves showing the prognost i c sign ificance of circ-BIR C6 expression for HCC patients (with median value used as the cut-off point). Data are presented as mean :1: SD. *P < 0.05, ***P < 0.0 I, ***P < 0.00 I.
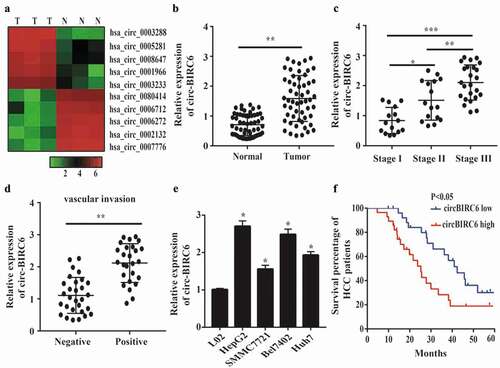
Table 2. Univariate and multivariate cox regression analyses circ-BIRC6 for OS of patients in the cohort
Figure 2. circ-BIRC6 knockdown represses HCC cell proliferation, migration, and invasion and promotes apoptosis. (a) Relative expression of circ-BIRC6 and BlRC6 mRNA in HepG2 and Bel7402 cells transfected w ith an si-circ against BIRC6 (si-circ-BTRC6) or negative control siRNA (si-NC), as determined by qRT-PCR. (b) circ-BIRC6 deletion inhibits the proliferation of HepG2 and Bel7402 cells, as shown with the CCK-8 assay. (c) circ-BIRC6 silencing increases apoptosis in HepG2 and Bel7402 cells, as detected by flow cytometry. (d, e) ci.rc-BIRC6 knockdown represses HepG2 and Bel7402 cell migration and invasion, as determined with the transwell assay. Data are presented as mean ± SD. *P < 0.05, **P < 0.0 I, ***P < 0.001.
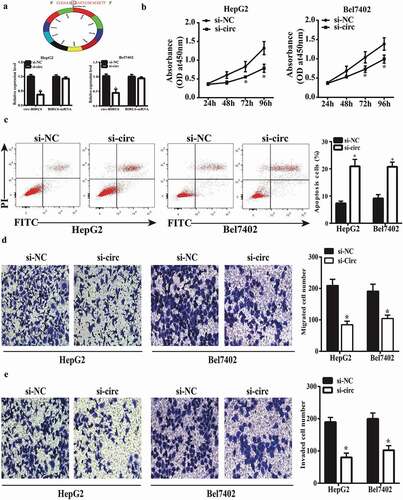
Figure 3. circ-BIRC6 overexpress ion promotes HCC cell pro! iferation, migration, and invasion and inhibits apoptosis. (a) Relative expression of circ-BIRC6 in HepG2 and Bel7402 cells transfected with overexpression and empty vector. oeCirc, cirGBIRC6 overexpression vector; oeVec, control overexpression vector. (b) ciro-BIRC6 overexpression promotes the proliferation in HepG2 and Be17402 cells, as determined with the CCK-8 assay. (c) Cell apoptosis was inhibited in the circ-BlRC6 overexpression group relative to control cells iJl the flow cytometry analysis. (d, e) Migration and invasion of HepG2 and Bel7402 cells lransfected witb oeCirc or oeVec were evaluated with the transwell assay. Data are presented as mean± SD. *P < 0.05, **P < 0.0 I, ***P < 0.00 1.
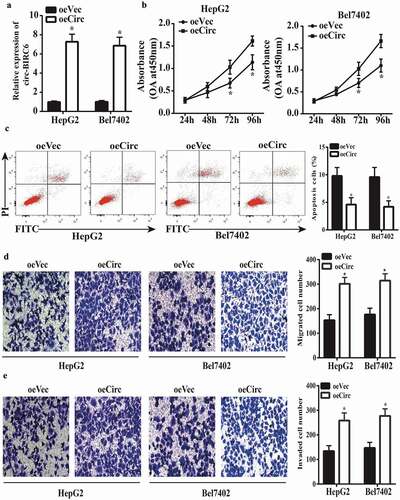
Figure 4. circ-BJRC6 directly targets miR-3918. (a) Colocalization of circ-BlRC6 (red) and miR-3918 (green) in HepG2 cells was observed by FISH. Cell nuclei were counterstained with 4’,6-diamidino-2-pbenyl .indol e (blue). (b) Potential miR-3918 binding sites in circ-BJRC6. (c) Co-traostection with miR −3918 mim ic reduces the luciferase activity of circ-BLRC6 WT but not circ-BIRC6 Mut in 293T cells, as determined with the dual-luciferase reporter assay. (d) circ-BIRC6 and miR-3918 were enriched in Ago2 as compared to control [gG] immunoprecipitates. (e) circ-BIRC6 IOlockdown promotes miR-3918 expression in HepG2 and Bel7402 cells, as determined by qRT-PCR. (f) mi.R-3918 was downregulated in HCC as compared to adjacent norma l tissue. (g) Con·elation between circ-BIRC6 and miR −3918 levels in HCC tissue (n = 55). Data are presented as mean ± SO. *P < 0.05, **P < 0.01, ***P < 0.001.
![Figure 4. circ-BJRC6 directly targets miR-3918. (a) Colocalization of circ-BlRC6 (red) and miR-3918 (green) in HepG2 cells was observed by FISH. Cell nuclei were counterstained with 4’,6-diamidino-2-pbenyl .indol e (blue). (b) Potential miR-3918 binding sites in circ-BJRC6. (c) Co-traostection with miR −3918 mim ic reduces the luciferase activity of circ-BLRC6 WT but not circ-BIRC6 Mut in 293T cells, as determined with the dual-luciferase reporter assay. (d) circ-BIRC6 and miR-3918 were enriched in Ago2 as compared to control [gG] immunoprecipitates. (e) circ-BIRC6 IOlockdown promotes miR-3918 expression in HepG2 and Bel7402 cells, as determined by qRT-PCR. (f) mi.R-3918 was downregulated in HCC as compared to adjacent norma l tissue. (g) Con·elation between circ-BIRC6 and miR −3918 levels in HCC tissue (n = 55). Data are presented as mean ± SO. *P < 0.05, **P < 0.01, ***P < 0.001.](/cms/asset/677c76dd-fb96-4d1f-8f07-8a800dc84785/kccy_a_1601477_f0004_oc.jpg)
Figure 5. Circ-BIRC6 promotes Bcl2 expreSSIOn by spongmg miR-3918. (a) miR-3918 binding sites m the 3’ UTR of Bcl2 transcript. (b) Co-transfection with roiR-391 8 mimic decreases the luciferase activity of WT 3’ UTR ofBcl2 transcript in 293T cells, as determined with the dual-luciferase reporter assay. (c-f) miR-3918 overexpression and circ-BIRC6 knockdown inhibit Bcl2 mRNA (c, d) and protein (e, f) levels in HepG2 and Bel −7402 cells, as determined by qRT-PCR and western blotting, respectively.(g-j) miR-3918 inhibitor and circ-BTRC6 overexpression produced the opposite etfect on Bcl2 mRNA (g, h) and protein (i, j) levels. (k, l) Negative correlation between miR-3918 and Bcl2 levels (k) and positive con·elation between Bcl2 and circ-BrRC6 levels (l) in HCC tissues (n = 55). Data are present ed as mean ± SD. *P < 0.05, **P < 0.01, ***P < 0.001.
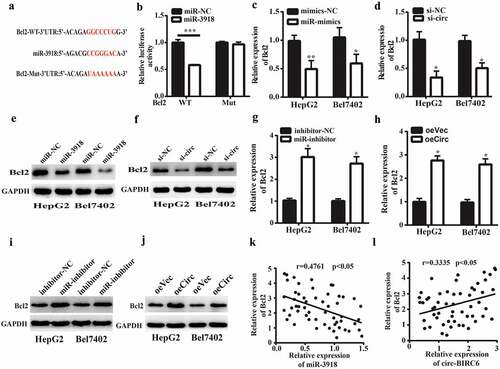
Figure 6. miR-3918 inhibition reverses the effect of circ-BlRC6 depletion. (a) Cell proliferation was evaluated with the CCK-8 assay. (b, c) miR-3918 and Bcl2 expression in HepG2 and Bel7402 cells, as determined by qRT-PCR. (d) Detection of apoptosis by flow cytometry. (e, f) Mig1·ation and invasion of HepG2 and Bel7402 cells, as determined with the transwell assay. (g) The protein expression of Bcl2 in HepG2 and Bel7402 cells, as determined by western blotting. Data are presented as mean ± SD. *P < 0.05, **P < 0.01, ***P < 0.001.
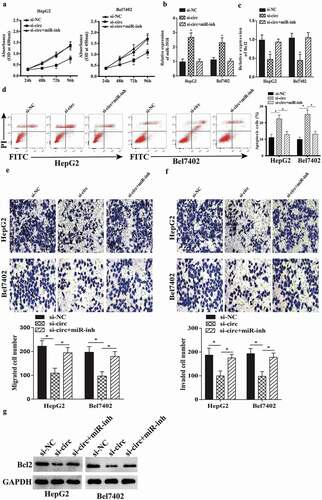
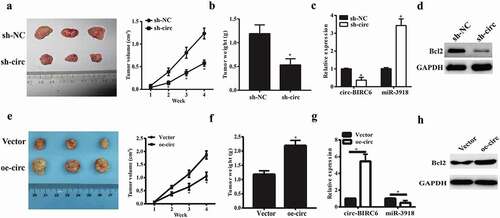
Figure 7. Effect ofcirc-BIRC6 knockdown and circ-BIRC6 overexpressionon tumor growth in vivo. Xenografts formed by subcutaneous injection of Bel7402 cells stably transfected with sh-NC (negative control shRNA), sh-circ(sh-Circ-BfRC6), Vector(empty vector), oe-circ(overexpressed circ-BTRC6 vectory into the flanks of nude mice.(a.e) Tumor growth curve based on measured tumor volumes. (b.f) Tumor weight at the endpoint of the experiment. (c.g) Relatwe expression of circ-BIRC6 and miR-3918 in tumors derived l1·om Bel7402 cellstransfected with sh -eire, sh-NC, vector and oe-circ respectively. (d.h) Protein level of Bcl2 was examined in the resected tumors by western blot. Data are presented as mean± SD. *P < 0.05, **P < 0.0 1, ***P < 0.001.