Figures & data
Figure 1. miR-1225 expression in PC tissues of patients and PC cell lines. (a) miR-1225 expression in pancreatic tumors cells from better prognosis (n = 10), medium prognosis (n = 10), and poor prognosis (n = 10) patients with AML and normal volunteer (n = 10), as analyzed using qPCR. (b) miR-1225 expression was compared between PC tumors cells and normal pancreatic tissues from volunteers. (c) miR-1225 expression in PC cell lines and normal pancreatic cells. Data are represented in the form of mean ± SD. *P< 0.05, **P< 0.01.
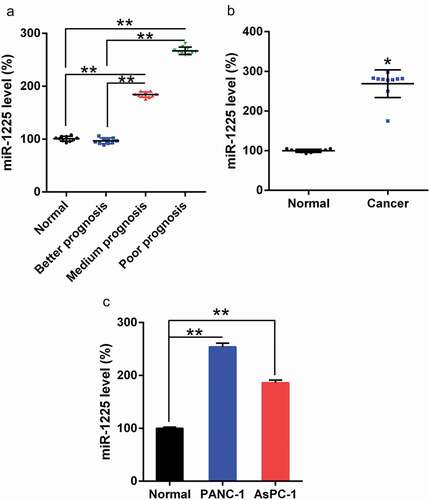
Figure 2. miR-1225 silencing inhibits xenograft pancreatic tumor formation. (a) Expression of miR-1225 in the pancreatic tissue of each group was examined by qPCR analysis. (b) AsPC-1 cells infected with Adenovirus-miR-1225 inhibitor (Inhibitor) or control cells (NC) were subcutaneously injected into mice (n = 10 per group). Mice were sacrificed, and tumors were weighed at day 28 post-inoculation. Tumors were weighed after excision from each group. (c) Representative photographs of nude mice at day 30 post-inoculation. (d) Tumor growth curve during 28 days post-inoculation. Data represent the mean ± SD. *P< 0.05, **P< 0.01.
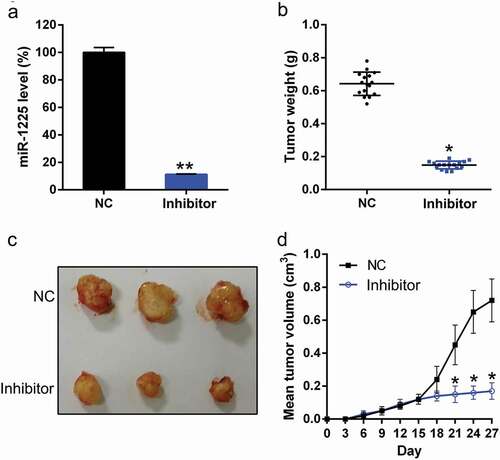
Figure 3. Effect of miR-1225 expression on the proliferation of PANC-1 and AsPC-1 cells. (a, b) Expression of miR-1225 in PANC-1 and AsPC-1 cells transfected with the miR-1225 inhibitor (Inhibitor) or NC inhibitor (NC), as measured by qPCR. (c, d) Proliferation rate of PANC-1 and AsPC-1 cells was measured at 24, 48, and 72 h post-transfection using the EdU assay. (e, f) Soft agar colony formation assay of the PANC-1 and AsPC-1 cells transfected with the miR-1225 inhibitor or NC inhibitor. The lower panel indicates the number of colonies formed in each group. Data are represented in the form of mean ± SD. *P < 0.05, **P < 0.01, ***P< 0.001.
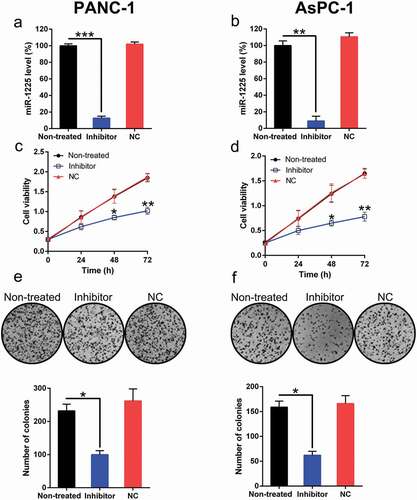
Figure 4. Aberrant expression of miR-1225 enhances the apoptosis of PC cell lines. PANC-1 and AsPC-1 cells were transfected with the miR-1225 inhibitor (Inhibitor) or NC inhibitor (NC). (a, b) TUNEL staining was carried out to examine the number of apoptotic cells in each group of PANC-1 and AsPC-1 cells. Magnification, ×200. Positive Hoechst 33,342 staining in each group of these cells is displayed in the lower panel. (c, d) Annexin V-FITC/PI staining and FC were performed to evaluate the number of apoptotic cells. The upper right quadrant of each plot represents early apoptotic cells. Apoptotic rate analysis in PANC-1 and AsPC-1 cells from each group, as shown in the lower panel. Data are represented in the form of mean ± SD. *P < 0.05, **P < 0.01 versus control group.
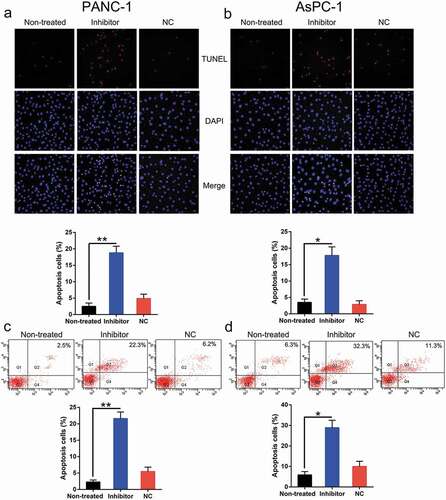
Figure 5. JAK1 is a direct target of miR-1225. (a) Graphical representation of the conserved miR-1225 binding motif at the 3′-UTR of JAK1. (b) Luciferase activity displayed by the luciferase reporter constructs carrying either the wild-type (WT) or mutated (MU) human JAK1 3′-UTR after miR-1225 mimic transfection. The luciferase activity was normalized to the activity of β-galactosidase. miR-1225 mimic markedly decreased the relative luciferase activity in cells carrying the WT 3′-UTR but not in those MU 3′-UTR. PANC-1 and AsPC-1 cells were transfected with the miR-1225 inhibitor (Inhibitor) or NC inhibitor (NC). Western blotting (c) showed the expression of JAK1 and STAT3 in PC cell lines. qPCR analysis (d, e) was used to confirm the downregulation in JAK1 expression in PC tumors and PC cell lines. Western blotting (f, g) and qPCR (h, i) were performed to evaluate JAK1 and STAT3 protein and mRNA expressions, respectively, after transfection of PANC-1 and AsPC-1 cells with miR-1225 inhibitor and NC inhibitor. Data are represented in the form of mean ± SD. *P < 0.05, **P < 0.01, ***P< 0.001.
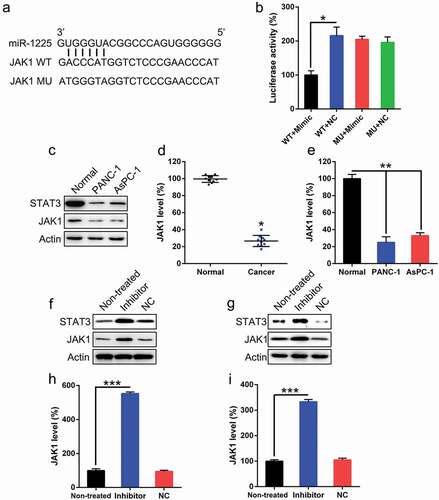
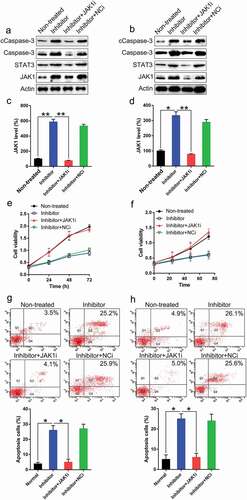
Figure 6. Silencing of JAK1 expression restores the suppressive effect of miR-1225 on the characteristics of PC cell lines. PANC-1 and AsPC-1 cells were co-transfected with the miR-1225 inhibitor (Inhibitor) and shRNA-JAK1 (JAK1i)/shRNA-NC (NCi). (a-d) Expression of JAK1, STAT3, Caspase-3, and cleaved Caspase-3 (cCaspase-3) was examined in PANC-1 and AsPC-1 cells at both protein and mRNA levels following transfection with different agents. JAK1i represent RNA interference of CDC14B. (e, f) JAK1 silencing induced the proliferation of PANC-1 and AsPC-1 cells. (g, h) JAK1 knockdown eliminated the apoptotic effect of the miR-1225 inhibitor. Annexin V-FITC/PI staining and FC were carried out to evaluate the number of early apoptotic PANC-1 and AsPC-1 cells after 48 h of transfection. Results are presented as mean ± SD. *P < 0.05, **P < 0.01.