Figures & data
Figure 1. Hsa_circ_0002577 was increased in EC. (a) Relative expression of hsa_circ_0002577 in EC tissues was detected by qRT-PCR. (b) Relative expression of hsa_circ_0002577 was increased in EC patients with tumor stage III-IV. (c) relative expression of hsa_circ_0002577 was upregulated in EC patients with lymph node metastases. (d) Kaplan-Meier survival curves showed that high hsa_circ_000257 expression was associated with low overall survival of EC patients. *P < 0.05.
Figure 2. Hsa_circ_0002577 inhibition reduced EC cells proliferation. (a) hsa_circ_0002577 expression was decreased by siRNA transfection in ECC-1 and HEC-1-A cells. (b,c) CCK-8 and colony formation assays were used to explore the effects of hsa_circ_0002577 on EC cells proliferation. (d,e) flow cytometry analysis was used to determine the effects of hsa_circ_0002577 on EC cells cycle and apoptosis. *P < 0.05.
Figure 3. Hsa_circ_0002577 inhibition reduced EC cells invasion and EMT processes. (a,b) wound healing assay and transwell invasion assay were used to determine the effects of hsa_circ_0002577 on EC cells migration and invasion ability. (c,d) QRT-PCR and western blot assays were used to explore the effects of hsa_circ_0002577 on EMT markers (E-cadherin, N-cadherin, and vimentin) in ECC-1 and HEC-1-A cells. *P < 0.05.
Figure 4. Hsa_circ_0002577 functioned as a molecular sponge for miR-197. (a) QRT-PCR revealed that miR-197 had the highest enrichment value compared with other miRNAs. (b) The predicted binding sites for miR-197 in the 3ʹUTR of hsa_circ_0002577. (c) Dual luciferase reporter assay showed that miR-197 mimics significantly reduced the luciferase activity of circ_0002577 Wt in EC cells. (d) RIP assay showed that hsa_circ_0002577 and miR-197 were enriched in Ago2-containing miRNPs. (e) Relative expression of miR-197 was decreased in EC tissues. (f) MiR-197 expression was negatively correlated with hsa_circ_0002577 expression in EC tissues. (g) Relative expression of miR-197 in EC tissues was detected by starbase database. (h,i) CCK-8 and transwell invasion assays showed that miR-197 inhibitors reversed the effects of hsa_circ_0002577 inhibition on EC cells proliferation and invasion. *P < 0.05.
Figure 5. CTNND1 was a direct target of miR-197. (a) Potential binding site for miR-197 in the 3ʹUTR of CTNND1. (b,c) QRT-PCR and IHC were used to explore CTNND1 expression in EC tissues. (d) Kaplan-Meier plotter analysis showed that high CTNND1 expression was associated with poor overall survival of EC patients. (e) MiR-197 expression was negatively correlated with hsa_circ_0002577 expression in EC tissues. (f) Dual luciferase reporter assay showed that miR-197 mimics reduced the luciferase activity of CTNND1-Wt in EC cells. (g) Western blot showed that miR-197 mimics significantly suppressed CTNND1, β-catenin, cyclin D1, and c-Myc expression in EC cells. *P < 0.05.
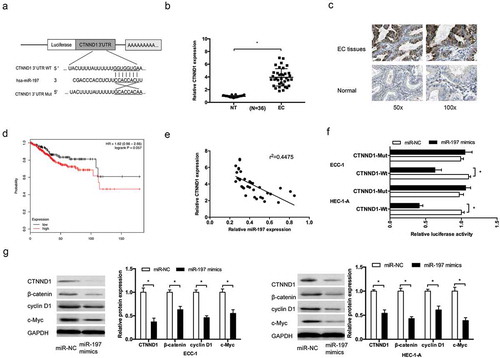
Figure 6. Restoration of CTNND1 abrogated the effects of hsa_circ_0002577 knockdown. (a,b) QRT-PCR and western bolt showed that hsa_circ_0002577 inhibition decreased CTNND1, and β-catenin expression, which could be abolished by miR-197 inhibitors. (c) CTNND1 expression was positively correlated with hsa_circ_0002577 expression in EC tissues. (d,e) CCK-8 and transwell invasion assays showed that hsa_circ_0002577 knockdown decreased the proliferation and invasion ability of EC cells, which could be abolished by CTNND1 overexpression. *P < 0.05.
Figure 7. Hsa_circ_0002577 inhibition suppressed EC growth in vivo. (a,b) Effect of sh-circ_0002577 on tumor growth. (c) Tumor weight of the sh-circ_0002577 group was significantly reduced than that of the sh-NC group. (d) Ki67 expression was determined by IHC in xenograft tumors. (e) Hsa_circ_0002577, miR-197, CTNND1 and β-catenin expression in xenograft tumors were determined by qRT-PCR. (f) CTNND1 and β-catenin protein expression in xenograft tumors were determined by Western blot. *P < 0.05.
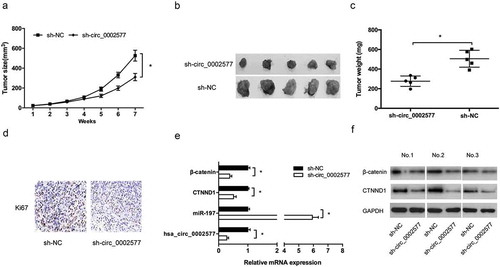
Figure 8. Schematic representation of hsa_circ_0002577 regulation in EC.