Figures & data
Figure 1. CNV rat models were successfully constructed by krypton-argon laser photocoagulation.
The results showed that, compared with the untreated rats (), there were five round white spots around the optic nerve head, which indicates that the Bruch’s membrane is disrupted and five bubbles are formed successfully (). At day 14 after photocoagulation, fundus fluorescein angiography (FFA) was performed to evaluate CNV formation. The fluorescein leakages of the fundus indicate that angiogenesis networks are formed in the laser-treated rats () compared with the untreated ones ().
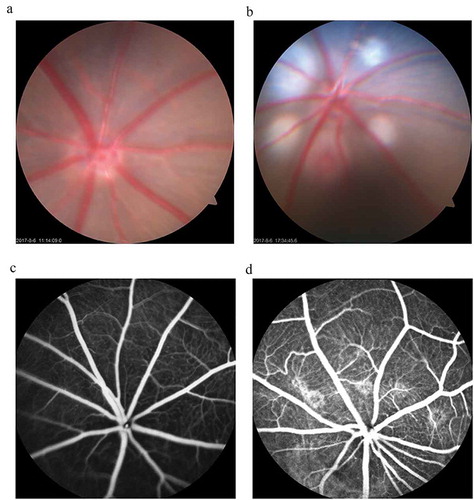
Figure 2. Slit2-N significantly reduced areas and relative thicknesses of the CNV networks.
Outlines of the CNV lesions in each group at each time point were sketched and measured (). The areas of the CNV networks are significantly smaller at days 14 (p<0.001), 21 (p<0.001) and 28 (p<0.01) in Laser + Slit2-N group than in Laser group while there was no significant difference between Laser group and Laser + Vehicle group at each time point (p>0.05). There was no significant difference among the Laser group, Laser + Vehicle group, Laser + Slit2-N group at day 7 (p>0.05) (). As the white lines show in each picture (), “T” refers to the actual thickness of the vascular networks, from the bottom of the pigmental choroidal layer to the top of the vascular networks. “C” refers to the laser-unaffected normal thickness of the choroid. Relative thickness (ratio) was calculated according to the equation, ratio = T-C/C. There was no significant difference between the Laser group and Laser + Vehicle group at each time point after the treatment (). However, the ratio statistically decreased in Laser + Slit2-N group compared with that in the Laser group at days 14 (p<0.01), 21 (p<0.01) and 28 (p<0.01). There was no significant difference between the two groups at day 7. (*p<0.05,** p<0.01, *** p<0.001)
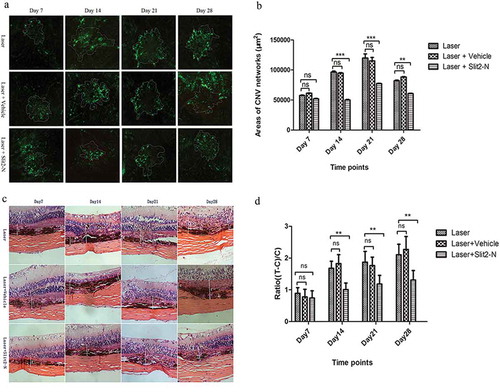
Figure 3. Screens on minimal effective concentrations of VEGF165 and maximal safe concentrations of Slit2-N, respectively, in HUVEC and HMVEC.
CCK-8 assay was used to evaluate proliferation and viability of the cells in each group of HUVEC and HMVEC. At hour 48 after the treatment, 25 ng/ml, 30 ng/ml and 35 ng/ml of VEGF165 significantly prompted the proliferation of HUVEC compared with the untreated group (p<0.0001, p<0.0001, p<0.0001, respectively) (). In HMVEC, 500 pM and 1000 pM of VEGF165 significantly promoted cell proliferation (p<0.01, p<0.0001) ().On the part of Slit2-N, the maximal safe concentration, which did not compact the cell viability, was 16nM in both HUVEC and HMVEC (). (*p<0.05, ** p<0.01, *** p<0.001, **** p<0.0001)
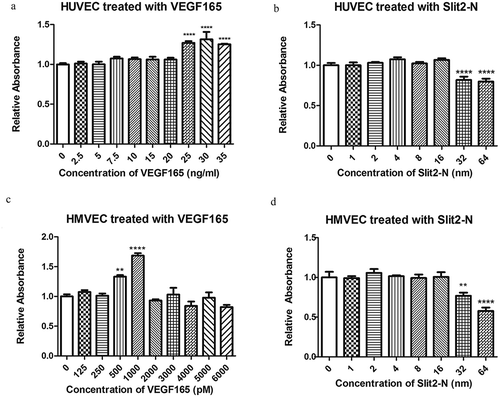
Figure 4. Slit2-N significantly reduced VEGF165-induced endothelia proliferation.
CCK-8 assay showed that, in both HUVEC and HMVEC, the cell proliferation in Slit2-N + VEGF165 group was significantly inhibited compared with that in VEGF165 group (p<0.05 and p<0.01, respectively, in HUVEC and HMVEC) (). Consistent with the CCK-8 results, the flow cytometry results showed that the proliferation index significantly decreased in Slit2-N + VEGF165 group compared with that in VEGF165 group in both HUVEC and HMVEC (p<0.01 in both HUVEC and HMVEC) (). (Proliferation index refers to the sum of the cells in all generations divided by the original parent cells number at the start of the experiment).
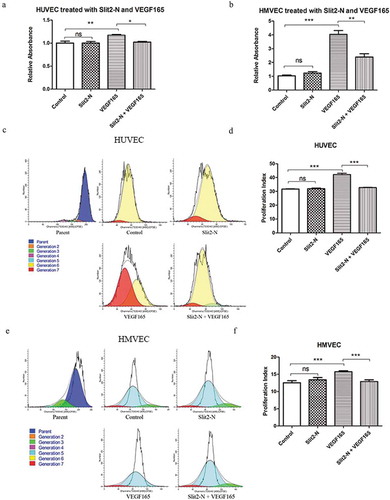
Figure 5. Phosphorylations of AKT and ERK1/2.
Phosphorylation of AKT significantly decreased in Slit2-N + VEGF165 group compared with that in VEGF165 group in both HUVEC and HMVEC (p<0.001 in HUVEC, p<0.01 in HMVEC), while no statistical difference in p-AKT was found between the Control group and Slit2-N group (p>0.05 in both HUVEC and HMVEC) (). No significant difference in phosphorylation of ERK1/2 was found between Slit2-N + VEGF165 group and VEGF165 group in either HUVEC or HMVEC (p>0.05 in both HUVEC and HMVEC) ().
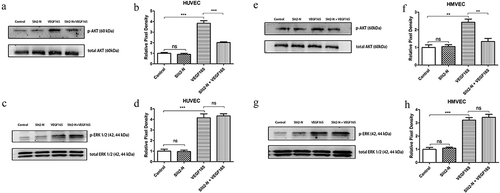
Figure 6. SC-79, an AKT activator, reversed the inhibitory effect of Slit2-N on VEGF165-induced proliferation.
Western blot results showed SC-79 significantly reversed the inhibitory effect of Slit2-N on phosphorylation of AKT in HUVEC () and HMVEC (); CCK-8 results showed that the administration of SC-79 significantly reversed the inhibitory effect of Slit2-N on VEGF165-induced cell proliferation in HUVEC and HMVEC ().
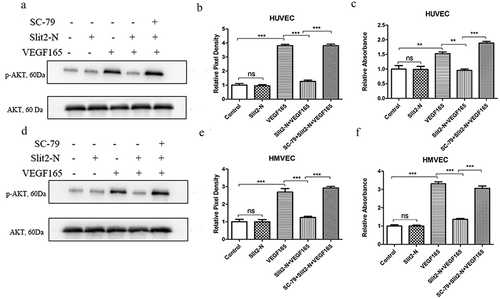
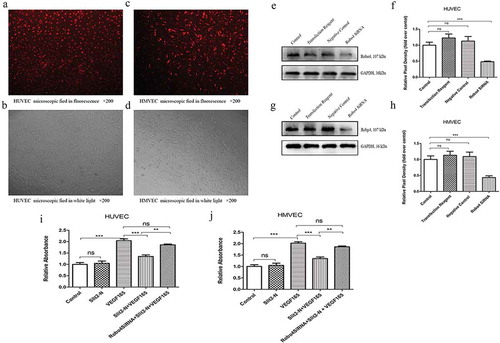
Figure 7. Robo4 siRNA suppressed Robo4 expression and it significantly reversed the inhibitory effect of Slit2-N on VEGF165-induced cell proliferation.
The Cy3 staining showed that the transfection rate (the number of stained cells divided by the number of the total cells) of the transfection reagent was around 90% in HUVEC () and HMVEC (). The western blotting results () showed that the Robo4 expression was inhibited in Robo4 siRNA group compared with Control group in both HUVEC (p<0.001) and HMVEC (p<0.001) (). The CCK-8 results showed that the proliferation in Robo4 SiRNA+Slit2-N+ VEGF165 group was significantly higher than that of Slit2-N+ VEGF165 group in both HUVEC (p<0.01) and HMVEC (p<0.01) ().