Figures & data
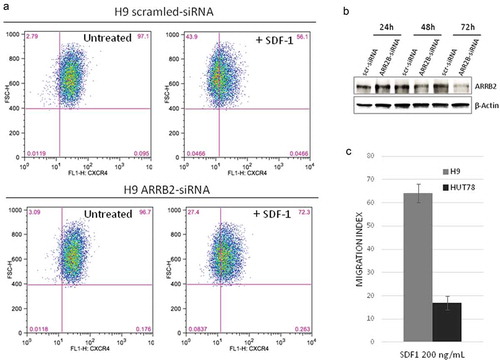
Figure 1. ARRB2 Depletion decreases CXCR4 internalization and migration index upon SDF-1 treatment.
(A) H9 cells depleted ofARRB2 by siRNA transfection (lower panel) show an increased number of CXCR4+cells upon SDF-1 treatment, when compared to scrambled control (upper panel). One representative experiment is shown in figure (n = 4, 66 ± 8,57 vs 54,93 ± 6,05; P = 0.039). (B) Western blot analysis confirms a reduction of ARRB2 protein in siRNA-transfected H9 cells respect to control (scr-siRNA) after 48 and 72 hours. (C) H9 cells (ARRB2 CN gain) show a higher migration response to SDF-1 than Hut78 cells (ARRB2W1) (n.4, FC = 3,85, P < 0.001).