Figures & data
Figure 1. Expression and subcellular localization of Nedd8 during mouse oocyte meiosis.
(a) Mouse oocytes were collected after culture for 0, 2, 6, 8, and 12 h, corresponding to germinal vesicle (GV), GV breakdown (GVBD), prophase of metaphase I (pro-MI), metaphase I (MI) and metaphase II (MII) stages, respectively. Whole lysates from 30 oocytes were loaded in each lane for dot blotting. Nedd8 levels were determined using an anti-Nedd8 antibody. The relative staining intensity of Nedd8 was assessed by densitometry in the histogram. Error bars represent the standard deviation. (b-f) Oocytes of different stages were collected for immunofluorescence staining. Blue: DNA; Green: α-tubulin; Red: Nedd8. Scale bar, 10 μm.
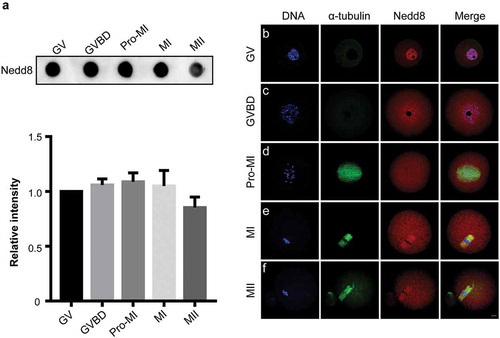
Figure 2. Inhibition of neddylation causes oocyte MI arrest.
(a) Images of oocytes in the control group and MLN4924-treated groups. Oocytes were cultured in medium with different concentrations of MLN4924 (0.1 μM, 0.5 μM, 1 μM and 5 μM) or without MLN4924. Scale bar, 100 μm. (b) Germinal vesicle breakdown (GVBD) rate and polar body exclusion (PBE) rate of control and MLN4924-treated oocytes. Error bars represent the standard deviation. ns: no statistical significance, *p < 0.05, **p < 0.01, ***p < 0.001. (c-d) Expression of Nedd8 after treated with different concentrations of MLN4924. Oocytes were cultured at MI stage and total lysate of 80 oocytes per group was loaded for dot blotting and western blotting. Nedd8 levels were determined using an anti-Nedd8 antibody. β-actin was used as a loading control. Relative intensities of bands are shown in the histograms. Error bars represent the standard deviation. ns: No statistical significance, *p < 0.05, **p < 0.01, ***p < 0.001. (e) Spindle morphology in control and MLN4924-treated oocytes. Blue: DNA; Green: α-tubulin; Red: Nedd8. Scale bar, 10 μm.
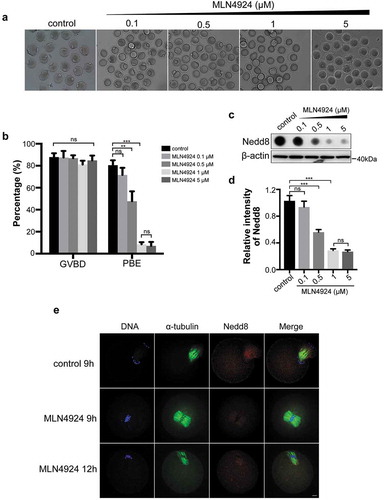
Figure 3. Depletion of Nedd8 blocks mouse oocytes maturation process.
(a-b) Control and Nedd8 RNAi oocytes were cultured to Pro-MI stage, and were collected for dot blotting assay and western blotting. β-actin was used as a loading control. Relative intensities of bands are shown in the histograms. Error bars represent the standard deviation. ***p < 0.001. (c) Images of control and Nedd8 RNAi oocytes. Mouse oocytes were cultured to MII stage. Scale bar, 100 μm. (d) GVBD rate and PBE rate of control and Nedd8 RNAi oocytes. Error bars represent the standard deviation. ns: no statistical significance, ns: no statistical significance. ***p < 0.001. (e) Spindle morphology of control and Nedd8 RNAi oocytes. Blue: DNA; Green: α-tubulin; Red: Nedd8. Scale bar, 10 μm.
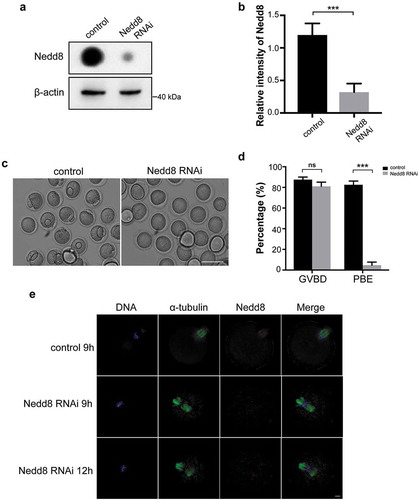
Figure 4. Inhibition of neddylation induces over-activation of the spindle assembly checkpoint (SAC).
Mouse oocytes were cultured in M2 medium for 7 h and 9 h, or in MLN4924 for 9 h, and then collected for chromosome spreading. (a-c) Immunofluorescence staining was performed after chromosome spreading. Core SAC proteins (Bub3, Mad2, and BubR1) were stained using specific primary and secondary antibodies. In control oocytes, the SAC was activated at 7 h, but the positive signal at kinetochores disappeared after MI at 9 h. However, they retained at kinetochores after MI in MLN4924-treated oocytes. Blue: DNA; Red: SAC core proteins. Scale bar, 10 μm. (d) Two hundred oocytes in each sample were lysed, and followed by western blotting for Bub3, Mad2, and BubR1 detection. β-actin was used as a loading control.
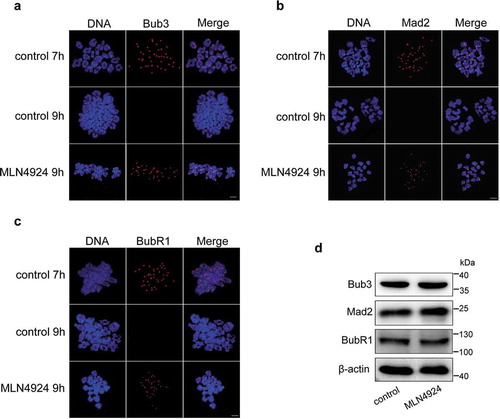
Figure 5. Cullin1 neddylation decreased after neddylation inhibition.
(a) qRT-PCR was performed to examine the expressions of eight cullin transcripts in mouse oocytes (200 oocytes/sample). The relative expression levels are shown in the histograms. Error bars represent the standard deviation. (b-c) The expression of Cullin1 and Cullin1-Nedd8 during mouse oocyte maturation. β-actin was used as a loading control. Relative intensities of bands are shown in the histograms. Error bars represent the standard deviation. (d-e) Anti-Cullin1 antibody was used to examine Cullin1 and Cullin1-Nedd8 in the control and MLN4924-treated mouse oocytes. β-actin was used as a loading control. Relative intensities of bands are shown in the histograms. Error bars represent the standard deviation. ns: no statistical significance, ***p < 0.001. (f-g) Expression of Cullin1 in control and Cullin1 RNAi oocytes. β-actin was used as a loading control. Relative intensities of bands are shown in the histograms. Error bars represent the standard deviation. ***p < 0.001. (h-i) Images of control and Cullin1 RNAi oocytes after cultured for 12 h. GVBD and PBE rates are shown in the histograms. Error bars represent the standard deviation. ns: no statistical significance, ***p < 0.001. Scale bar, 100 μm.
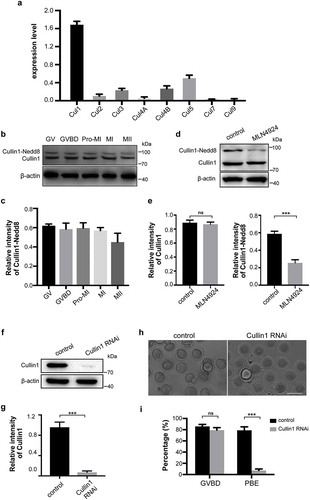
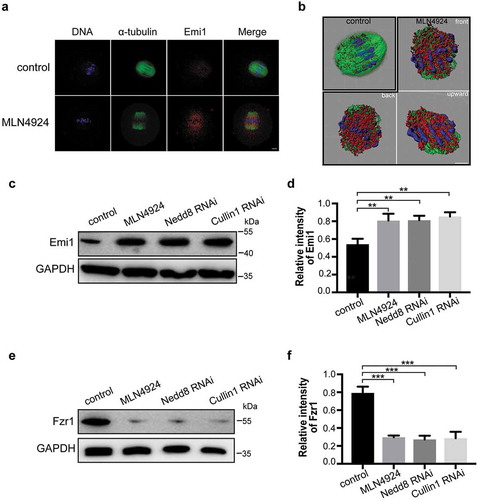
Figure 6. Emi1 is a potential substrate of neddylation-mediated ubiquitination.
(a) Control and MLN4924-treated mouse oocytes were cultured and collected at MI stage for immunofluorescence staining. Blue: DNA; Green: α-tubulin; Red: Emi1. Scale bar, 10 μm. (b) 3-D modeling of control and MLN4924-treated oocytes. 3-D models were constructed using the Imaris program. Isosurface renderings of the oocytes were created and rotated in 3-D space to assess morphology. (c-f) Western blotting detection of Emi1 and Fzr1 protein levels in control, Nedd8 RNAi and Cullin1 RNAi oocytes. β-actin was used as loading control. Relative intensities of bands are shown as bar graph in the histograms. Error bars represent the standard deviation. *p < 0.05, ***p < 0.001.