
Figures & data
Figure 1. Comparison between DAPK1 and DAPK2 sequence and domain structure. (a) A schematic representation of the different domains of DAPK1 and DAPK2. Major phosphorylation sites are marked. CaM ARD – CaM autoregulatory domain. (b) Alignment of DAPK1 and DAPK2. The amino acid sequences of human DAPK1 (UniProt IP P53355) and human DAPK2 (UniProt ID Q9UIK4) were aligned using the Protein BLAST algorithm (amino acids 181–320 shown). Ser289 is highlighted in yellow and the surrounding sequence marked by a rectangle.
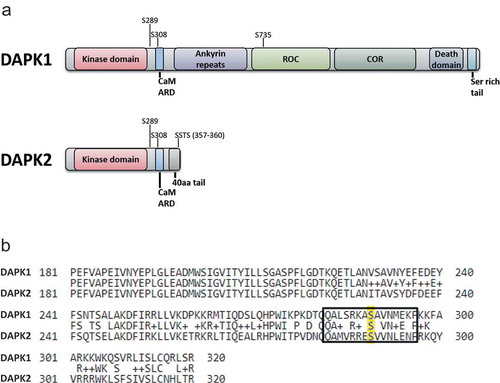
Figure 2. Ser289 phosphorylation activates DAPK1 and DAPK2 in response to different triggers. (a) HCT116 cells were transfected with either HA-DAPK1 or HA-DAPK2 and treated with either 200µM resveratrol (RSV) for 2 h or serum-starved overnight and then treated with 100nM PMA for 30 min. Untreated cells were used as control. Anti-HA immunoprecipitates were resolved by SDS-PAGE and Ser289 phosphorylation of the immunoprecipitated proteins was measured by specific antibodies. DAPK1 Ser289 phosphorylation was monitored using an antibody that recognizes the sequence RXRXXpSer/Thr, which was previously shown to specifically detect phosphorylation of DAPK1 on Ser289 [Citation53]. DAPK2 Ser289 phosphorylation was monitored using an antibody specifically raised against pSer289 DAPK2 [Citation46]. Two representative immunoprecipitation results, from two separate biological replicates (IP #1 and IP #2, left panel), are shown. Total cell extract (TCE, right panel) was used to monitor activation of the relevant pathways by the triggers, and to monitor the expression of HA-DAPK1/DAPK2. The TCE results shown belong to experiment #2 and are representative of both experiments. (b) HA-DAPK1 WT, S289A or S289D was incubated in a kinase reaction mixture with MLC, and phosphorylation assessed by western blotting of the reaction mixtures. pMLC band intensity was quantified using NIH ImageJ software. Bar graph represents pMLC intensity as mean ± SD of three independent repeats. Statistical analyses were performed using one-way ANOVA with post hoc Dunnett’s multiple comparison test. **P< 0.01.
![Figure 2. Ser289 phosphorylation activates DAPK1 and DAPK2 in response to different triggers. (a) HCT116 cells were transfected with either HA-DAPK1 or HA-DAPK2 and treated with either 200µM resveratrol (RSV) for 2 h or serum-starved overnight and then treated with 100nM PMA for 30 min. Untreated cells were used as control. Anti-HA immunoprecipitates were resolved by SDS-PAGE and Ser289 phosphorylation of the immunoprecipitated proteins was measured by specific antibodies. DAPK1 Ser289 phosphorylation was monitored using an antibody that recognizes the sequence RXRXXpSer/Thr, which was previously shown to specifically detect phosphorylation of DAPK1 on Ser289 [Citation53]. DAPK2 Ser289 phosphorylation was monitored using an antibody specifically raised against pSer289 DAPK2 [Citation46]. Two representative immunoprecipitation results, from two separate biological replicates (IP #1 and IP #2, left panel), are shown. Total cell extract (TCE, right panel) was used to monitor activation of the relevant pathways by the triggers, and to monitor the expression of HA-DAPK1/DAPK2. The TCE results shown belong to experiment #2 and are representative of both experiments. (b) HA-DAPK1 WT, S289A or S289D was incubated in a kinase reaction mixture with MLC, and phosphorylation assessed by western blotting of the reaction mixtures. pMLC band intensity was quantified using NIH ImageJ software. Bar graph represents pMLC intensity as mean ± SD of three independent repeats. Statistical analyses were performed using one-way ANOVA with post hoc Dunnett’s multiple comparison test. **P< 0.01.](/cms/asset/412b4ba5-85de-467b-bb76-665330718423/kccy_a_1617616_f0002_b.gif)