Figures & data
Figure 1. Characteristics and generation of cell cycle G2/M phase fluorescent sensor. (a), The expression pattern and localization of cyclin B1 were showed by graph in the different phases of cell cycle. (b), Schematic of the cyclin B1 fused EGFP as a fluorescent probe illuminated various phases of cell cycle. (c), The structure of human cyclin B1 promoter drove cyclin B1 fused EGFP construct, destruction and subcellular localization of sensor are controlled by destruction box (D-box), cytoplasmic retention sequences (CRS) localized in the N-terminal portion of cyclin B1. (d), HEK293, c2c12 and HeLa cells were transfected with plasmid, the different localizations and intensity of EGFP signal showing the cells in different phases of cell cycle. G1/S phases EGFP signal is very low and localized in cytoplasm. The EGFP signal is increased and localized in cytoplasm in G2 phase. The EGFP signal is high and localized from cytoplasm to nucleus in prophase phase. Nuclear envelope is broken down in metaphase and the EGFP signal is very high and full of whole cell. (e), The quantification of EGFP density of HEK293, c2c12 and HeLa cells in the various cell cycle phases has been performed, the EGFP is significantly increased in the G2, prophase and metaphase compare to the G1 and S phases. (f), The expression levels of cyclin B1 and EGFP in transfected HEK293, c2c12 and HeLa cells and control non-transfected cells were detected by western-blot.
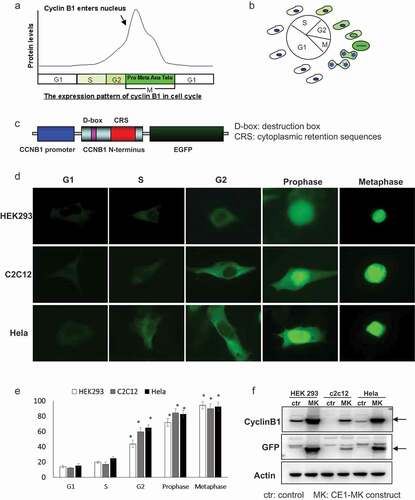
Figure 2. Construct strategy of multi-fluorescent sensors and expression in vitro. Construct strategy of the three fluorescent sensors of cell cycle progress was designed as diagram. The constructs were transfected into HEK293 cells to confirm the function of expression. (a), Cyclin B1 promoter drove cre recombinase initiates the cascade reaction of the fluorescent sensors. Cyclin B1 promoter drove cyclin B1 fused EGFP with double loxP sites and Flp is a key plasmid to show proliferating cells. CMV promoter drove DsRed and EYFP fragment with double Frt sites is indicating the proliferated cell transition from red to yellow fluorescence. Cotransfected of triple plasmids would be possible to recognize the cell population with variety fluorescence. (b), CMV-DsRed–EYFP and Cyclin B1-EGFP-Flp plasmids were transfected into HEK293 cells respectively. (c), CMV-DsRed-EYFP and Cyclin B1-EGFP-Flp plasmids were cotransfected into HEK293 cells together showing G1 phase cells (red arrows) and G2 phase cells (white arrows). (d), Cyclin B1-cre, CMV-DsRed-EYFP and Cyclin B1-EGFP-Flp plasmids were cotransfected into HEK293 cells together showing the cells passed one cell cycle (red arrows) and the cells in the first cell cycle (white arrows).
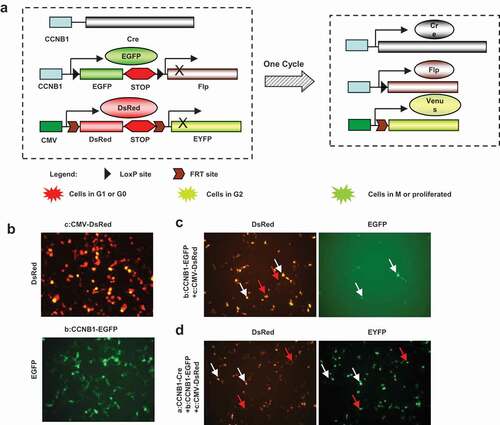
Figure 3. The expression pattern of G2/M phase fluorescent probe in primary and cell lines. (a), HEK293 cells were transfected with the plasmid of G2/M phase fluorescent probe and synchronized in various cell cycle phases. The population of cells in different phases were monitored by FACS. (b), Transfected HEK293 cells were synchronized and detected the expression of cell cycle markers: cyclin D1, cyclin E1, cyclin B1, and p-Histon H3, CDC2, p-CDC2, PCNA; the expression of recombinase: Cre, Flp, the internal control: Actin by Western-blot. (c), Neonatal rat cardiomyocytes were infected with EGFP sensor adenovirus. C2c12 and HeLa cells were transfected with G2/M phase fluorescent sensor construct. Cells were performed immunofluorescence with anti-cyclin B1 antibody (red) and DAPI (blue). The localization of cyclin B1 is similar with cyclin B1-EGFP fusion protein. (d), Neonatal rat cardiomyocytes were infected with EGFP sensor adenovirus. Cells were performed for immunofluorescence with anti-P-Histone H3 (Ser10) antibody (red) and DAPI (blue). The detail events of mitosis were displayed by EGFP sensor.
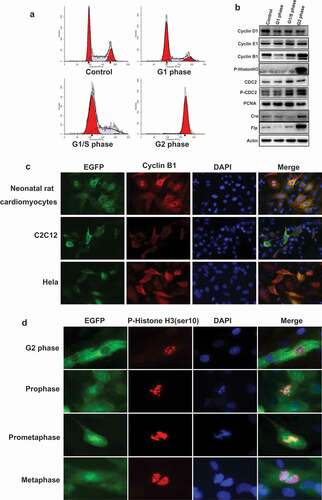
Figure 4. G2/M phase fluorescent sensor knock-in transgenic mouse generation and probe in embryo. (a), Mouse ES cells were electroporated with EGFP sensor construct fragments. The EGFP signal showing the positive ES colonies indicated the genomic integration. (b), The PCR primers for transgenic mice genotyping was designed in the GFP fragment. (c), The positive and negative transgenic mice were recognized by the production of PCR. (d), The GFP signal of the cryosections of transgenic mouse CCB1E-MK embryo (E14.5) were detected. The dorsal (posterior) root ganglion area was shown in the low magnification (100x) and high magnification (400x). The G2 phase cells were shown in the high magnification (1000x), with GFP signal in the cytoplasm. (e), Cryosections of transgenic mouse CCB1E-MK embryo (E10.5) were stained with antibody against EGFP, and detected with ABC-DAB system in low magnification (50x), the EGFP signal showing dorsal (posterior) root ganglion (arrows). Cryosections from wild type mice embryo (E10.5) were performed same experiment without any positive signal as the control.
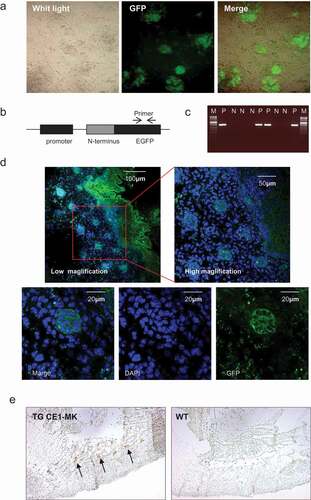
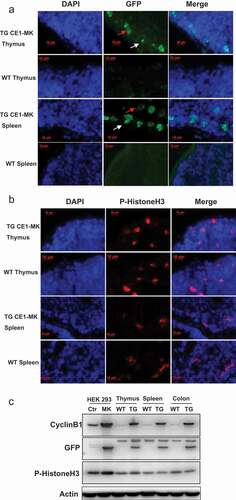
Figure 5. G2/M phase fluorescent sensor expression in adult tissues of knock-in transgenic mouse. (a), Cryosections of thymus and spleen from adult transgenic mouse CE1-MK and wild type mouse were stained with DAPI. Some cells in CE1-MK mouse section are EGFP positive showing the cells in mitosis, while wild type mouse sections as the control have not any EGFP positive signal. (b), Cryosections of thymus and spleen from adult transgenic mouse CE1-MK and wild-type mouse were stained with antibody against P-Histone H3 (Ser10). Some cells in CE1-MK mouse and control wild-type mouse sections are P-Histone H3 positive showing the cells in mitosis. C, Western-blot result showed that P-Histone H3 expressed in adult mouse thymus, spleen and colon tissue. The protein levels of cyclin B1 and EGFP were detected in CE1-MK transgenic and wild type control mice. The expression of cyclin B1 is increased in CE1-MK mice and the EGFP is only expressed in transgenic mice. Actin was detected as the loading control of western-blot.