Figures & data
Figure 1. Hela cells stably expressing variants of Cav-1. (A) Western blot detecting Control, Cav-1 OE and Cav-1 ∆CSD indicates increased expression of Cav-1 and Cav-1 ∆CSD. The Cav-1 antibody results in a native Cav-1 band (upper) and a Cav-1 ∆CSD band (lower) for cells expressing Cav-1 ∆CSD. Actin was used as a loading control. (B) Densitometric quantification of Cav-1 expression in stable cell lines. Cav-1 expression increased twofold in Cav-1 OE or Cav-1 ∆CSD expressing cells compared with control cells. *P< 0.05 vs. Control cells by one-way ANOVA. (C) Immunochemistry of expression of Cav-1 OE and Cav-1 ∆CSD shows normal localization. Wheat germ agglutinin, a cell membrane stain, was used to confirm normal cell morphology.
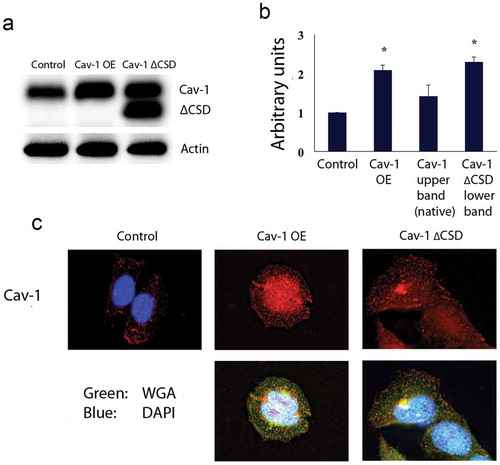
Figure 2. Cav-1 overexpression decreased cell migration via CSD. (A) Representative images of hematoxylin stained migrated cells. (B) Quantification of migrated cells in control, Cav-1 OE and Cav-1 ∆CSD cells. The migration was increased in Cav-1 ∆CSD cells while Cav-1 overexpression inhibited cell migration compared with control cells. *, + P< 0.05 vs. Control, Cav-1 OE cells, respectively (one-way ANOVA). (C and D) Epithelial–mesenchymal transition markers were analyzed to determine if the CSD alters this transition to induce migratory phenotype. Zonula occludens (ZO-1) and vimentin expression were assessed. Cav-1∆CSD significantly decreased ZO-1 and showed a trend towards an increase in vimentin expression in cells compared to control and Cav-1 OE. *, + P< 0.05 vs. Control (one-way ANOVA).
Figure 3. STAT3 phosphorylation was decreased in Cav-1 overexpression cells and overexpression of CSD alone decreases STAT3 phosphorylation and cell migration. (A) Representative western blot analyses of STAT-3, phospho-STAT3, gp130, JAK and phosphor-JAK, and SOCS3 in control, Cav-1 OE and Cav-1 ∆CSD cells. Actin was used as a loading control. (B) Densitometric quantification of phosphor/total STAT-3 and JAK (other proteins were unchanged) in control, Cav-1 OE and Cav-1 ∆CSD cells. Phospho-STAT3 was decreased whereas phosphor-JAK was increased in Cav-1 OE cells compared with control and Cav-1 ∆CSD cells. *P< 0.05 vs. LacZ. (one-way ANOVA). (C) Representative western blot analyses of phosphor/total STAT3 following STAT3 siRNA treatment (scrambled vector was used as control). (D) Representative images of hematoxylin stained migrated cells (top) and quantification of migrated cells (bottom) in scrambled control vs STAT3 siRNA treated cells. Loss of STAT3 decreased migration. *, + P< 0.05 vs. Scr (one-way ANOVA). (E) pEGFP tagged SCD or scrambled vector were transiently expressed in HeLa or HT-29 colorectal cancer cell line. GFP was observed in scrambled and CSD vector-treated cells. (F) Representative western blot analyses of CSD and scrambled vector with EGFP in HeLa cells for phospho/total STAT3. CSD treatment decreased pSTAT3. CSD expression led to decreased migration in HeLa (G) and HT29 (H) cells.
Figure 4. CSD contribute to cell proliferation and cell cycle arrest. (A) Proliferation assessed by [3H]-thymidine incorporation, was reduced in Cav1 ∆CSD cells compared with control and Cav-1 OE cells. *P< 0.05 vs. LacZ. (one-way ANOVA). (B) Representative image of FACS. The DNA content of propidium iodide-stained nuclei were analyzed by FACSCalibur flow cytometry, as described in Materials and Methods. (C) The percentage of cells in phase G1, S and G2/M. *P< 0.05 vs. Control cells. (one-way ANOVA). (D) Representative western blot analyses of Cdc2 and phospho-Cdc2 in Control, Cav-1 OE and Cav-1 ∆CSD cells.
![Figure 4. CSD contribute to cell proliferation and cell cycle arrest. (A) Proliferation assessed by [3H]-thymidine incorporation, was reduced in Cav1 ∆CSD cells compared with control and Cav-1 OE cells. *P< 0.05 vs. LacZ. (one-way ANOVA). (B) Representative image of FACS. The DNA content of propidium iodide-stained nuclei were analyzed by FACSCalibur flow cytometry, as described in Materials and Methods. (C) The percentage of cells in phase G1, S and G2/M. *P< 0.05 vs. Control cells. (one-way ANOVA). (D) Representative western blot analyses of Cdc2 and phospho-Cdc2 in Control, Cav-1 OE and Cav-1 ∆CSD cells.](/cms/asset/c827e505-d44f-43b2-ae63-1a27ee640e16/kccy_a_1618118_f0004_b.gif)
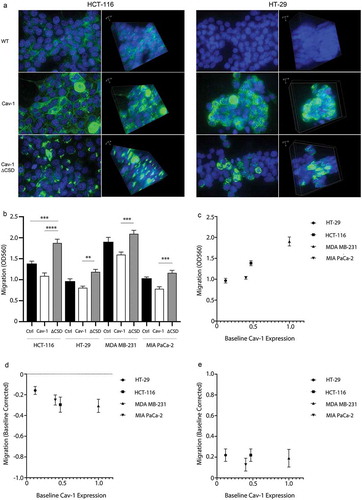
Figure 5. Cell migration in multiple cancer cells is impacted by exogenous Cav-1 and Cav-1∆CSD. (A) HCT-116 and HT-29 cells were grown on laminin-coated 35 mm glass bottom dishes, transduced with either Cav1 or Cav1∆CSD, and stained with both Cav1 (green) and DAPI (blue). Left panels at 2-D images whereas the right panels represent 3-D Z-stacked images of multiple sections. (B) HCT-116, HT-29 cells, MDA-MB-231 cells, and MIA PaCa-2 cells (~150,000/well, n = 5) were transduced with either Cav1 or Cav1∆CSD and migration was assessed using an 8uM Boyden chamber insert, followed by cell staining and calorimetric quantification (OD 560 nm). Scatter plots of cell migration (y-axis) as a function of baseline caveolin-1 protein expression (x-axis) under baseline conditions (C) as well as baseline-normalized conditions following exogenous Cav-1 (D) and Cav-1∆CSD (E) expression.