Figures & data
Figure 1. Increased longevity in C57BL/6 mice fed a MR diet. Three-month-old C57BL/6 mice were randomized into a control group (n = 10) and a diet group (n = 10). The control group (AL) was fed AIN-93 chow, and the diet group (MR) was fed chow in which the methionine content was reduced to 15% of that in the control diet.
Table 1. Metabolic parameters and renal functions in the OAL and OMR groups
Figure 2. Representative pictures and histology scores of glomerular and tubulointerstitial lesions based on standard procedures. (a) The black arrows indicate a fibrous crescent, cell proliferation, and glomerulosclerosis in the glomerular lesions and interstitial inflammatory cell infiltration in the tubulointerstitial lesions. MR improved glomerular and tubulointerstitial lesions. (magnification ×400) (b) Histology scores based on standard procedures were not significantly different between the OMR and OAL groups. (c-e) The levels of albuminuria, KIM-1, and NGAL in urine of different groups. The quantitative analysis included 20 random fields per mouse. The data are presented as the means ± SD (n = 6–8).
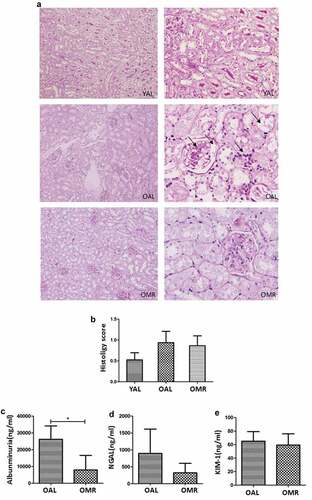
Figure 3. MR slows senescence and suppresses the SASP in the kidneys through TSP and AMPK/mTOR. (a and b) Levels of senescence markers p16, p53, p21 and IL-1β in the young group (3-month-old), control group (OAL), and diet group (OMR). (c and d) Levels of IL-1β and IL-6 in the kidneys in the young group (3-month-old), control group (OAL), and diet group (OMR). (magnification ×40) (e and f) MR increases the TSP key enzyme CGL and H2S levels. (e) Levels of the TSP key enzyme CGL in the kidneys in the young group (3-month-old), control group (OAL), and diet group (OMR). (f) Concentrations of H2S in the serum in the young group (3-month-old), control group (OAL), and diet group (OMR). *P < 0.05. (g-i) MR increases phospho-AMPK and attenuates phosphor-mTOR levels. (G) Levels of phospho-AMPK in the kidneys in the young group (3-month-old), control group (OAL), and diet group (OMR). (h-j) Levels of phospho-mTOR and its downstream target phospho-4EBP1 and phosphor-S6K in the kidneys. Three replicates were used for western blot quantification. Values are presented as means ± SD. *P < 0.05, **P < 0.01, ***P < 0.001 versus OAL. NS, not significant. (n = 6–8).
Figure 4. MR slows IS-induced senescence and suppresses the SASP in HK-2 cells. (a–c) Western blot analyses showing the levels of the senescence markers p53 and p21 in the three groups. (d) Serum-starved HK-2 cells were incubated with or without IS (250 μM) for 48 h; then, the cells were stained for SA β-gal, and the number of SA β-gal-positive cells was counted. (magnification ×400) (e and f) The levels of IL-1β and IL-6 in cell culture supernatants were analysed by ELISA. (g-i) Immunofluorescence results show IL-1β and IL-8 staining. The fluorescence intensity was lower in the IS+MR group than in the IS group. (magnification ×200). Three replicates were used for quantification. Values are presented as means ± SD. *P < 0.05, **P < 0.01.
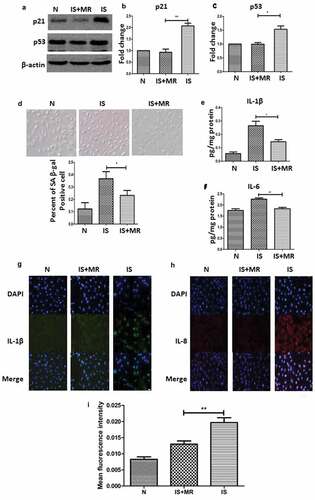
Figure 5. MR increases H2S production and AMPK/mTOR phosphorylation. (a) Levels of CGL assessed by Western blot; CGL activation was lower in the IS group than in the IS+MR group. (b) H2S levels were increased by MR in HK-2 cells. (c and d) Phosphorylated AMPK levels were significantly increased after MR treatment. The protein band intensities are presented as ratios compared to the intensities of the total bands; the data from the control group were arbitrarily set as 1.0. Three replicates were used for quantification. Values are presented as means ± SD.
Figure 6. Suppression of IS-induced senescence in HK-2 cells by MR is regulated by H2S and AMPK/mTOR. Cells were incubated with 8 μM CC and with or without IS for 48 h. (a and b) Levels of the senescence markers p53 and p21 were analysed by Western blot. (c and d) Levels of IL-1β and IL-6 in cell culture supernatants were analysed by ELISA. (e) Cellular H2S concentrations. (f and g) Western blots showing changes in CGL and the AMPK/mTOR pathway. *p < 0.05,**p < 0.01,***p < 0.001 versus IS+MR. #p < 0.05 versus IS+MR.