Figures & data
Figure 1. HMGA1 knockdown increases NUMB expression. (A) Western blot analyses for HMGA1 (upper panel) and NUMB (lower panel) in scramble (C1) and HMGA1-knockdown (shA1) BTSC#83 (left) and BTSC#30p (right). GAPDH was used as loading control. (B) Immunofluorescence analyses for HMGA1 and NUMB in control and HMGA1-KD BTSC#83 and BTSC#30p cells. Scale bar = 10 μm. C) qRT-PCR for NUMB expression in control (C1) and HMGA1-silenced (shA1) BTSC#83 (left panel) and #30p cells (right panel). Fold changes are shown relative to scramble-transfected cells (C1), with respect to the G6PD expression in each sample. Data are the mean value of 4 independent experiments performed in duplicate or triplicate (*p ≤ 0.05, Student’s t-test).
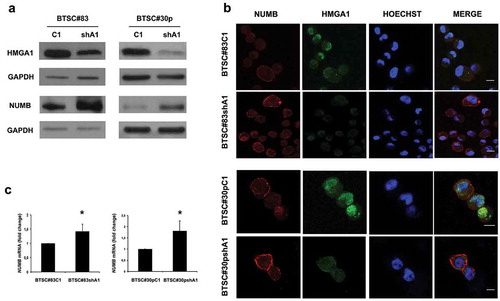
Figure 2. HMGA1-KD HeLa cells overexpress NUMB. (A) qRT-PCR for HMGA1 performed in scramble- (HeLa scr) and HMGA1 shRNA-transfected HeLa cells (HeLA shA1). Fold changes are shown as mean value ± SD of three different clones, relative to scramble-transfected cells, with respect to actin expression. Representative experiment (*p ≤ 0.05, Student’s t-test). (B) Western blot for HMGA1 and NUMB in one HeLa scramble clone and three different shA1 clones. Vinculin expression was used as loading control. (C) Representative images of immunofluorescence staining for NUMB in HeLa scr and shA1 clones. Nuclei were stained with DAPI. Magnification: 63X.
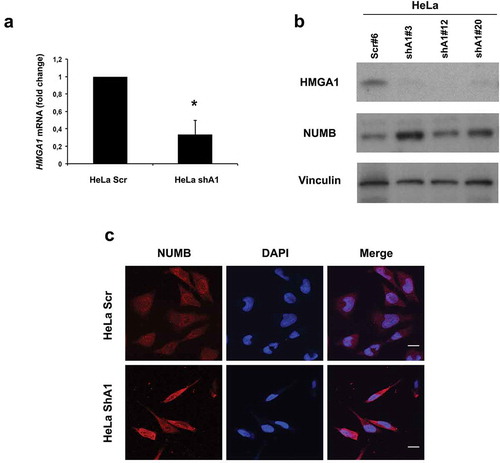
Figure 3. HMGA1 regulates NUMB expression at transcriptional level. (A) ChIP assay, revealed by qPCR, detecting the in vivo binding of HMGA1 to the sub-regions I–III in the NUMB promoter in BTSC#83C1 and shA1 chromatin extracts. The relative fold enrichment of the NUMB promoter regions by HMGA1 is indicated as vertical bars. The 2–ΔΔCt formula was used to calculate the relative fold enrichment, normalized to its IgG reference and relative to the calibrator (input). (***p ≤ 0.001, ANOVA test). (B) Luciferase activity of the NUMB promoter (NUMB luc) in HEK293 cells in presence of the HMGA1-antisense (antiA1), the HMGA1-expressing (HMGA1) vectors or the corresponding empty vectors. NUMB luciferase activity is shown as fold induction with respect to the NUMB promoter activity. Data are the mean value of four independent experiments ± SD (* p ≤ 0.05; ** p ≤ 0.01; *** p ≤ 0.001, Kruskal–Wallis test, Conover post hoc test).
Figure 4. c/EBP-β coregulates the NUMB promoter together with HMGA1. (A) Histogram showing the relative luciferase activity of the NUMB promoter reporter construct in HEK293 cells in the presence of HMGA1 and c/EBP-β-expressing constructs. Luciferase activity was normalized by β-galactosidase activity. Data are the mean value of four independent experiments ± SD (* p ≤ 0.05; Student’s t-test). (B) ChIP assay for c/EBP-β on NUMB promoter regions I–III, using immunoprecipitated chromatin from BTSC#83C1 and BTSC#83shA1 cells. The 2–ΔΔCt formula was used to calculate the relative fold enrichment, normalized to its IgG reference and relative to the calibrator (input). (***p ≤ 0.001, ANOVA test).
Figure 5. HMGA1 silencing affects NUMB expression at posttranscriptional level by regulating MSI1 and miR-146a. (A) qRT-PCR (left) and Western blot (right) evaluating the expression of MSI1 in scramble and HMGA1-KD BTSC#83 and BTSC#30p. Fold change was calculated using the 2–ΔΔCt formula, considering the scramble transfected cells as control. Data are the mean value ± SD of 4 independent experiments performed in duplicate or triplicate. (** p ≤ 0.01; *** p ≤ 0.001, Student’s t-test). (B) Histogram showing the qRT-PCR results for miR-146a expression in scramble and HMGA1-KD BTSC#83 and BTSC#30p. Data are the mean value ± SD of 3 independent experiments performed in duplicate or triplicate. (* p ≤ 0.05; ** p ≤ 0.01; *** p ≤ 0.001, Student’s t-test). (C) Western blots for MSI-HA and NUMB in BTSC#83shA1 cells transfected with a MSI-HA-expressing construct (Msi-HA) or with the corresponding empty vector (EV). Vinculin was used as loading control. Quantification of relative NUMB expression compared to Vinculin expression is indicated. (D) Western blot for NUMB in BTSC#83shA1 cells transfected with an miR-146a mimic or with NEG1 scramble oligonucleotide. Vinculin was used as loading control. Quantification of the relative NUMB expression compared to Vinculin expression is indicated. (E) Histogram of ChIP assays showing the binding of HMGA1 to the MSI1 (left) and miR-146a (right) promoters in BTSC#83C1 and shA1 extracts. The 2–ΔΔCt formula was used to calculate the relative fold enrichment, normalized to its IgG reference and relative to the calibrator (input). (*** p ≤ 0.001, ANOVA test).
Figure 6. NOTCH1 is downregulated in HMGA1-knockdown BTSCs. (A) Western blot for NOTCH1 and NOTCH1 targets (HES1, HEY1, SOX2) in extracts from control and HMGA1-KD BTSC#83 and BTSC#30p cells. (B) qRT-PCR analyses for HES1, HEY1 and SOX2 expression in control and HMGA1-KD BTSC#83 and BTSC#30p cells. Data are the mean value, ± SD of 2 independent experiments performed in duplicate or triplicate (*p ≤ 0.05, Student’s t-test). (C) qRT-PCR for NUMB and HES1, HEY1 and SOX2 in BTSC#83antiA1 cells transfected with NUMB shRNA (shNUMB) or with the scramble vector (Scr). Data are the mean value ± SD of 2–3 independent experiments performed in triplicate. (*** p ≤ 0.001, Student’s t-test).