
Figures & data
Table 1. Summary of microarray datasets used in this study
Figure 1. KIF23 expression is significantly up-regulated in ovarian cancer and predicts poor prognosis for ovarian cancer patients.
A: Venn diagrams showed DEGs that had common changes from the four cohort profile data sets (GSE14407, GSE18520, GSE38666 and GSE40595). The DEGs consisting of 243 up-regulated (Left) and 474 down-regulated genes (Right) were detected with p < 0.05 and [logFC] > 1.5 as the cut-off criterion. The overlaps meant the commonly changed DEGs. Different colors were used to distinguish different data sets; B: The protein–protein interaction network of top 10 hub genes; C: Prognostic value of four genes (AURKA, BUB1, KIF23 and TOP2A) in ovarian cancer patients (HR: hazard ratio); D: The expression level of KIF23 in 426 ovarian cancer tissues and 88 normal ovarian tissues from GEPIA (OV: Ovarian serous cystadenocarcinoma; T: Tumor; N: Normal); E: The expression levels of KIF23 mRNA and protein in ovarian epithelial normal cell line and ovarian cancer cell lines; F: The expression levels of KIF23 mRNA and protein in normal ovarian tissues and ovarian cancer tissues (T: Tumor; N: Normal); G: Immunohistochemical analyses of KIF23 in normal ovarian tissues (n = 16) and ovarian cancer tissues (n = 116) (x100); Expression of KIF23 was significantly up-regulated in ovarian cancer tissues; H: Bar plot showed the proportion of high or low expression of KIF23 in normal or ovarian cancer tissues; I: Overall survival analysis of KIF23 expression revealed that high expression of KIF23 is associated with poor prognosis in 116 ovarian cancer patients (p = 0.0095); Blue and orange represented the high and low expression of KIF23, respectively. (Data were shown by mean ± SEM from three independent experiments; *P < 0.05; **P < 0.01; ***P < 0.001; ****P < 0.0001, as compared to date from control groups).
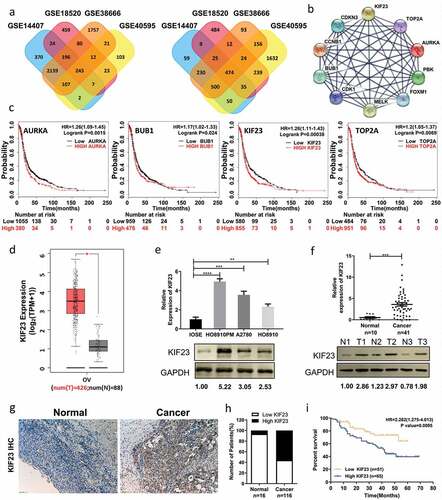
Figure 2. The correlation analyses between KIF23 and cell cycle-related proteins.
A: Using the STRING online database, total of 717 DEGs were filtered into the DEGs protein–protein interaction (PPI) network complex. PPI network modules were screened by Molecular Complex Detection (MCODE) plug-in. The most significantly functional module in the protein–protein interaction network was showed; B: Enrichment of signaling pathways of DEGs conducted in the module; C: The PPI network of KIF23 and cell cycle-related genes (BUB1, BUB1B, CCNB1, CCNB2, CDK1, MCM2, PTTG1 and TTK); D: The correlation analyses from GEPIA between KIF23 and cell cycle-related genes. Significant correlations were observed between KIF23 mRNA expression and mRNA expression of BUB1 (R = 0.72, P < 0.001), BUB1B (R = 0.74, P < 0.001), CCNB1 (R = 0.59, P < 0.001), CCNB2 (R = 0.81, P < 0.001), CDK1 (R = 0.66, P < 0.001), MCM2 (R = 0.52, P < 0.001), PTTG1 (R = 0.42, P < 0.001), TTK (R = 0.63, P < 0.001) (R: Pearson Correlation Coefficient); E: The expression of KIF23 mRNA is positively correlated with the expression of Ki67 mRNA analysed by GEPIA in ovarian serous cystadenocarcinoma tissues from TCGA (R = 0.67, P < 0.001); F: GSEA indicating KEGG CELL CYCLE signatures pathways was more correlated with patients with KIF23 high versus KIF23 low patients (FDR: False Discovery Rate).
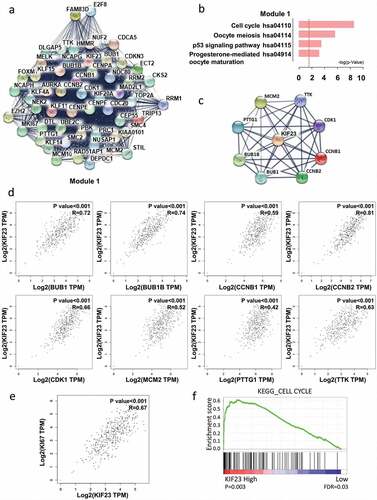
Figure 3. The effect of KIF23 on proliferation, migration and cell cycle.
A-C: The CCK8 assays (A), Colony formation assays (B) and Flow cytometric analysis (C) were carried out in HO8910PM cells expressing the negative control or siRNA of KIF23 and in HO8910 cells expressing the vector control or KIF23; D-E: The transwell assays (D) and wound healing assays (E) shows that inhibition or overexpression of KIF23 can inhibit or promote cell migration, respectively. (Data were shown by mean ± SEM from three independent experiments; **p < 0.01, ***p < 0.001, as compared to the control groups).
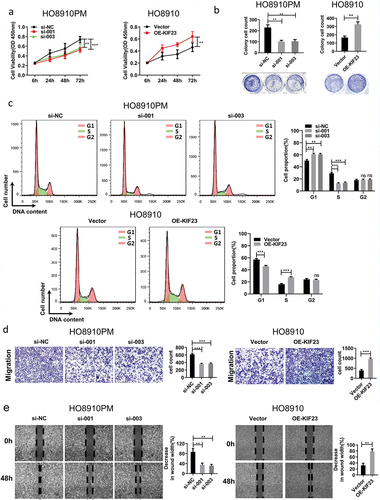
Figure 4. KIF23 is directly targeted by miR-424-5p and miR-503-5p in vitro.
A: Venn diagram displayed intersection of miRNAs computationally that predicted to target KIF23 by mirwalk and 92 down-regulated microRNAs from the GSE47841 cohort profile data; B: The five candidates were computationally predicted to target KIF23 by mirwalk; This software program incorporates the following online tools: DIANAmT, PicTar4, PicTar5, miRanda, miRWalk, miRDB, RNAhybrid, RNA22, PITA and TargetScan. The candidates could be predicted by at least five or more online tools mentioned above were chose for further study; C: The expression levels of five candidates in normal ovarian tissues and ovarian cancer tissues from the GSE47841 cohort profile data; D: HO8910PM cells were transfected with five candidate microRNAs mimics or miR-Ctrl mimic and KIF23 mRNA levels were analyzed after 48 h; E: Schematic of predicted miR-424-5p and miR-503-5p binding sites on the 3ʹ-UTR of KIF23; F: The expression of miR-424-5p mRNA is positively correlated with the expression of miR-503-5p mRNA in normal ovarian tissues and ovarian cancer tissues from the GSE47841 cohort profile data (R = 0.8689, P < 0.001); G: The expression of miR-424-5p and miR-503-5p were significantly down-regulated in 41 ovarian cancer tissues, compared with normal (***p < 0.001); H: The correlation coefficient heatmap for miR-424-5p, miR-503-5p and KIF23 in normal ovarian tissues (n = 10) and ovarian cancer tissues (n = 41). The upper triangular part of heatmap indicated raw correlation coefficient which represented by the number in box and color of the box. The lower triangular part is the scatter plots of miR-424-5p, miR-503-5p and KIF23. MiR-424-5p and miR-503-5p were obviously positively correlated with each other (R = 0.5578, P < 0.001). KIF23 was negatively correlated with miR-424-5p (R = -0.4405, P = 0.0014) and miR-503-5p (R = -0.3938, P = 0.0017); I: The expression levels of miR-424-5p (top part) and miR-503-5p (bottom part) in ovarian epithelial normal cell line and ovarian cancer cell lines; J: HO8910PM cells were transfected with mimics or miR-Ctrl mimic and HO8910 cells were transfected with inhibitors or miR-Ctrl inhibit, the mRNA and protein levels of KIF23 were analyzed after 48 h; K: Schematic of luciferase reporter constructs with the wild-type or mutated (altered residues in purple) KIF23 3ʹ untranslated region (3ʹUTR) downstream of the Firefly luciferase reporter gene (top panel). Luciferase activity was assayed and calculated by the ratio of firefly/Renilla luciferase activity (bottom panel). (Data were shown by mean ± SEM from three independent experiments. R: Pearson Correlation Coefficient; *P < 0.05; **P < 0.01; ***P < 0.001; ****P < 0.0001, as compared to control groups).
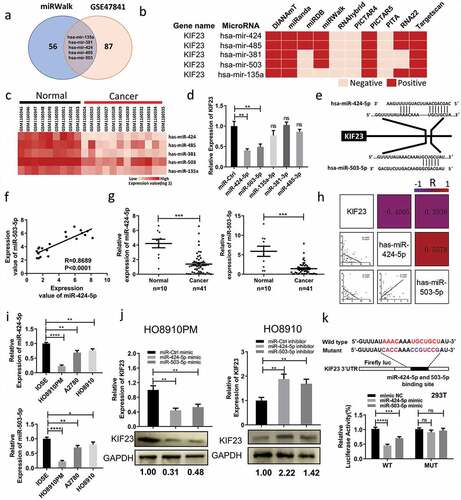
Figure 5. MiR-424-5p and miR-503-5p regulate KIF23 to influence proliferation, migration and cell cycle of ovarian cancer cells.
A: The mRNA and protein levels of KIF23 were examined after transfected miR-424-5p and miR-503-5p mimics or inhibitors on KIF23 silencing or overexpressing in HO8910PM and HO8910 cells; B-C: The CCK8 assays (B) and Colony formation assays (C) were performed after transfected miR-424-5p and miR-503-5p mimics or inhibitors on KIF23 silencing or overexpressing in HO8910PM and HO8910 cells; D-E: The transwell assays (D) and wound healing assays (E) were performed after transfected miR-424-5p and miR-503-5p mimics or inhibitors on KIF23 silencing or overexpressing in HO8910PM and HO8910 cells; F: Flow cytometric analysis was performed after transfected miR-424-5p and miR-503-5p mimics or inhibitors on KIF23 silencing or overexpressing in HO8910PM and HO8910 cells, while the graph shows quantification for each phase. (Data were shown by mean ± SEM from three independent experiments; **P < 0.01; ***P < 0.001; ****P < 0.0001, as compared to the control groups).
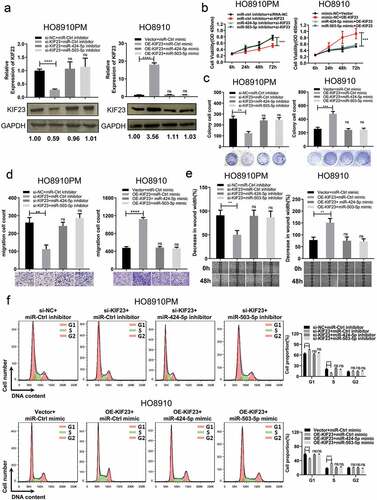
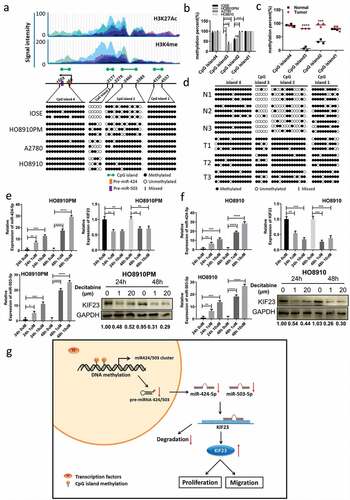
Figure 6. Restoration of miR-424/503 expression and downregulation of KIF23 by demethylation.
A: BSP analysis of CpG islands methylation status in miR-424/503 cluster promoter region: Four CpG islands, from −4557 to −4150 (CpG island1), from −3383 to −2460 (CpG island2), from −2279 to −2177 (CpG island3) and from +50 to +503 (CpG island4) in miR-424/503 promoter region (the transcriptional start site was set as +1), were predicted via online software “methprimer”; Top part shows the coordinate active histone modification state from ENCODE; B: The statistical results of methylation levels of ovarian epithelial normal cell line and ovarian cancer cell lines; C-D: The statistical results of methylation levels of normal ovarian tissues and ovarian cancer tissues; E-F: Effects of decitabine (1 um, 20 um) on the miR-424-5p and miR-503-5p expression in HO8910PM (E) and HO8910 (F) cells. The mRNA and protein levels of KIF23 were analyzed after adding decitabine (1 um, 20 um) into HO8910PM (E) and HO8910 (F) cells; G: Proposed Regulatory Model for miR-424/503 cluster/KIF23 Axis in ovarian cancer Progression: Expression of miR-424-5p and miR-503-5p was silenced by hypermethylation of its promoter in ovarian cancer. MiR-424-5p and miR-503-5p inhibit cell proliferation and migration by directly targeting KIF23. (Data were shown by mean ± SEM from three independent experiments; *P < 0.05; **P < 0.01; ***P < 0.001; ****P < 0.0001, as compared to the control groups).
Supplemental material