Figures & data
Table 1. Antibodies applied in Western Blot.
Table 2. Primers applied in qPCR.
Figure 1. Change in cell viability and circ_0000950 expression after Aβ-42 insult. Aβ-42 insult reduced cell viability in NGF stimulated PC 12 cells (a) and primary cerebral cortex neurons from rat embryo cells (b), whereas circ_0000950 expression was not influenced by Aβ-42 insult in both NGF stimulated PC 12 cells (c) and primary cerebral cortex neurons from rat embryo cells (d). Comparison of cell viability and circ_0000950 expression was determined by t test. ***P< 0.001, NS, non-significant. P value < 0.05 was considered significant.
Figure 2. Circ_0000950 downregulated miR-103 and upregulated PTGS2. Circ_0000950 relative expression was promoted by circ_0000950 overexpression plasmids but suppressed by circ_0000950 shRNA plasmids in PC12 cellular AD model (a) and cellular AD model of cerebral cortex neurons (b). MiR-103 expression was decreased by circ_0000950 overexpression plasmids but increased by circ_0000950 shRNA plasmids in PC12 cellular AD model (c) and cellular AD model of cerebral cortex neurons (d). PTGS2 mRNA expression was inhibited by circ_0000950 overexpression plasmids but enhanced by circ_0000950 shRNA plasmids in PC12 cellular AD model (e, g) and cellular AD model of cerebral cortex neurons (f, h). Comparison of circ_0000950, miR-103 and PTGS2 mRNA expressions was determined by t test. ***P< 0.001, **P< 0.01, *P< 0.05. P value < 0.05 was considered significant.
Figure 3. Circ_0000950 promoted cell apoptosis in cellular AD models. Cell apoptosis rate was promoted by circ_0000950 overexpression plasmids but suppressed by circ_0000950 shRNA plasmids in PC12 cellular AD model (a, c) and cellular AD model of cerebral cortex neurons (b, d). Apoptotic marker C-Caspase 3 expression was increased by circ_0000950 overexpression plasmids but decreased by circ_0000950 shRNA plasmids in both PC12 cellular AD model and cellular AD model of cerebral cortex neurons (e). Bcl-2 expression was suppressed by circ_0000950 overexpression plasmids but promoted by circ_0000950 shRNA plasmids in PC12 cellular AD model and cellular AD model of cerebral cortex neurons (F). Comparison of cell apoptosis rate was determined by t test. **P< 0.01. P value < 0.05 was considered significant.
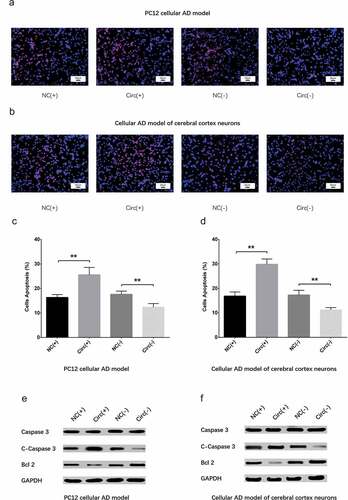
Figure 14. Circ_0000950 inhibited neurite growth in cellular AD models (72 h). Total neurite outgrowth was suppressed by circ_0000950 overexpression plasmids but enhanced by circ_0000950 shRNA plasmids in PC12 cellular AD model (a, c) and cellular AD model of cerebral cortex neurons (b, d). Comparison of total neurite growth was determined by t test. **P< 0.01, ***P< 0.001. P value < 0.05 was considered significant.
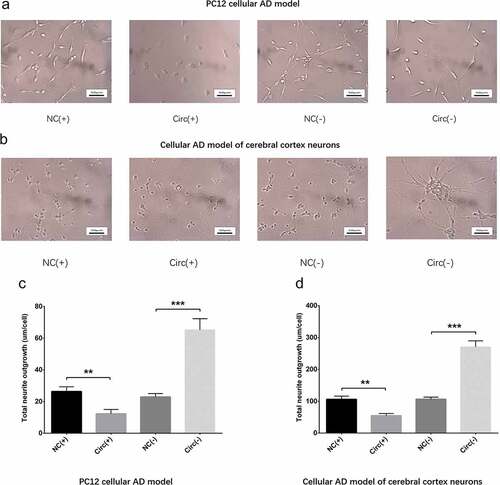
Figure 4. Circ_0000950 inhibited neurite growth in cellular AD models (48 h). Total neurite outgrowth was suppressed by circ_0000950 overexpression plasmids but enhanced by circ_0000950 shRNA plasmids in PC12 cellular AD model (a, c) and cellular AD model of cerebral cortex neurons (b, d). Comparison of total neurite growth was determined by t test. **P< 0.01, *P< 0.05. P value < 0.05 was considered significant.
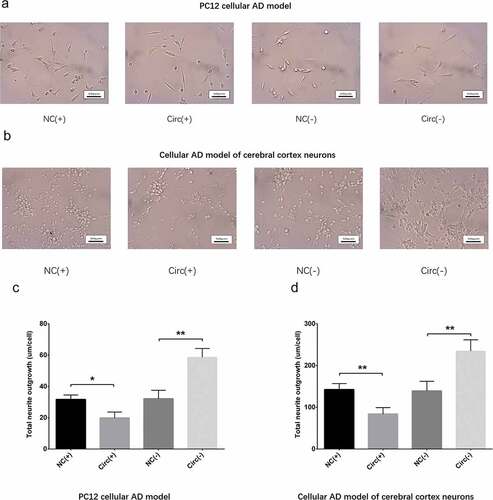
Figure 5. Circ_0000950 increased inflammatory cytokine levels in cellular AD models. IL-1β (a, b), IL-6 (b, d) and TNF-α (c, d) levels were elevated by circ_0000950 overexpression plasmids but decreased by circ_0000950 shRNA plasmids in PC12 cellular AD model. Also, IL-1β (e, h), IL-6 (f, h) and TNF-α (g, h) expressions were promoted by circ_0000950 overexpression plasmids but suppressed by circ_0000950 shRNA plasmids in cellular AD model of cerebral cortex neurons. Comparison of inflammatory cytokines levels was determined by t test. ***P< 0.001, **P< 0.01, *P< 0.05. P value < 0.05 was considered significant.
Figure 11. The targeting effect of circ_0000950 on miR-103 in cellular AD model of cerebral cortex neurons. Circ_0000950 expression was not influenced by miR-103 shRNA plasmids, and its inhibition by circ_0000950 shRNA plasmids was not affected by circ_0000950&miR-103 shRNA plasmids (a). MiR-103 expression was reduced by miR-103 shRNA plasmids, and its elevation by circ_0000950 overexpression plasmids was decreased by circ_0000950&miR-103 shRNA plasmids (b). Comparison of circ_0000950 and miR-103 expressions was determined by t test. ***P< 0.001, **P< 0.01, NS, non-significant. P value < 0.05 was considered significant.
Figure 6. The targeting effect of circ_0000950 on miR-103 in PC12 cellular AD model. Circ_0000950 expression was not influenced by miR-103 shRNA plasmids, and its inhibition by circ_0000950 shRNA plasmids was not affected by circ_0000950&miR-103 shRNA plasmids (a). MiR-103 expression was reduced by miR-103 shRNA plasmids, and its elevation by circ_0000950 overexpression plasmids was decreased by circ_0000950&miR-103 shRNA plasmids (b). Comparison of circ_0000950 and miR-103 expressions was determined by t test. ***P< 0.001, **P< 0.01, NS, non-significant. P value < 0.05 was considered significant.
Figure 12. Effect of circ_0000950 and miR-103 on cell apoptosis in compensation experiment (cellular AD model of cerebral cortex neurons). Cell apoptosis rate was facilitated by miR-103 shRNA plasmids, and reduction in cell apoptosis rate by circ_0000950 shRNA plasmids was attenuated by circ_0000950&miR-103 shRNA plasmids (a, b). C-caspase 3 expression was increased by miR-103 shRNA plasmids, and the reduction in C-caspase 3 expression by circ_0000950 shRNA plasmids was attenuated by circ_0000950&miR-103 shRNA plasmids. Bcl-2 expression was suppressed by miR-103 shRNA plasmids, and the increased in Bcl-2 expression by circ_0000950 shRNA plasmids was attenuated by circ_0000950&miR-103 shRNA plasmids (C). Comparison of cell apoptosis rate was determined by t test. *P< 0.05, **P< 0.01. P value < 0.05 was considered significant.
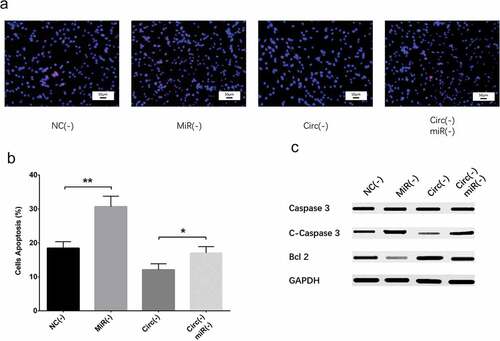
Figure 7. Effect of circ_0000950 and miR-103 on cell apoptosis in compensation experiment (PC12 cellular AD model). Cell apoptosis rate was facilitated by miR-103 shRNA plasmids, and reduction in cell apoptosis rate by circ_0000950 shRNA plasmids was attenuated by circ_0000950&miR-103 shRNA plasmids (a, b). C-caspase 3 expression was increased by miR-103 shRNA plasmids, and the reduction in C-caspase 3 expression by circ_0000950 shRNA plasmids was attenuated by circ_0000950&miR-103 shRNA plasmids. Bcl-2 expression was suppressed by miR-103 shRNA plasmids, and the increased in Bcl-2 expression by circ_0000950 shRNA plasmids was attenuated by circ_0000950&miR-103 shRNA plasmids (C). Comparison of cell apoptosis rate was determined by t test. **P< 0.01. P value < 0.05 was considered significant.
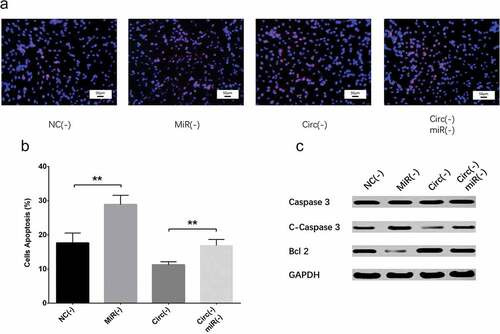
Figure 13. Effect of circ_0000950 and miR-103 on neurite growth in compensation experiment (cellular AD model of cerebral cortex neurons). Total neurite outgrowth was inhibited by miR-103 shRNA plasmids, and the increase in neurite growth by circ_0000950 shRNA plasmids was attenuated by circ_0000950&miR-103 shRNA plasmids (a, b). Comparison of total neurite growth was determined by t test. *P< 0.05, **P< 0.01. P value < 0.05 was considered significant.
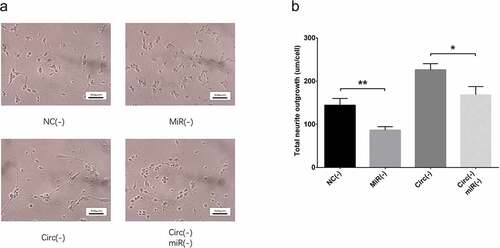
Figure 8. Effect of circ_0000950 and miR-103 on neurite growth in compensation experiment (PC12 cellular AD model). Total neurite outgrowth was inhibited by miR-103 shRNA plasmids, and the increase in neurite growth by circ_0000950 shRNA plasmids was attenuated by circ_0000950&miR-103 shRNA plasmids (a, b). Comparison of total neurite growth was determined by t test. **P< 0.01. P value < 0.05 was considered significant.
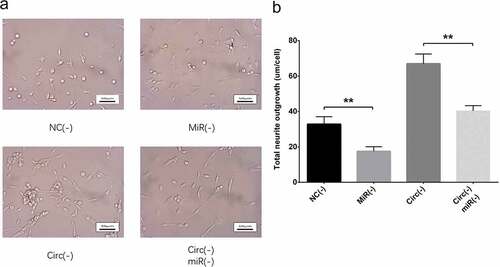
Figure 15. Effect of circ_0000950 and miR-103 on inflammatory cytokine levels in compensation experiment (cellular AD model of cerebral cortex neurons). IL-1β (a, d), IL-6 (b, d) and TNF-α (c, d) expressions were raised by miR-103 shRNA plasmids, and the reduction in IL-1β, IL-6 and TNF-α expressions by circ_0000950 shRNA plasmids was attenuated by circ_0000950&miR-103 shRNA plasmids. Comparison of inflammatory cytokines levels was determined by t test. **P< 0.01, *P< 0.05. P value < 0.05 was considered significant.
Figure 9. Effect of circ_0000950 and miR-103 on inflammatory cytokine levels in compensation experiment (PC12 cellular AD model). IL-1β (a, d), IL-6 (b, d) and TNF-α (c, d) expressions were raised by miR-103 shRNA plasmids, and the reduction in IL-1β, IL-6 and TNF-α expressions by circ_0000950 shRNA plasmids was attenuated by circ_0000950&miR-103 shRNA plasmids. Comparison of inflammatory cytokines levels was determined by t test. ***P< 0.001, **P< 0.01, *P< 0.05. P value < 0.05 was considered significant.
Figure 10. Luciferase reporter assay of circ_0000950. MiR-103 sequence as well as binding sites between circ_0000950 and miR-103 were shown (a). The relative luciferase activity for wild type circ_0000950 was reduced in the miR-103 group compared to a miR-NC group, while the relative luciferase activity for mutant circ_0000950 was unchanged in the miR-103 group compared to miR-NC group (b). Comparison of luciferase activity was determined by t test. **P< 0.01, NS, non-significant. P value < 0.05 was considered significant.