Figures & data
Figure 1. miR-337 expression in T cells from patients with CTCL and in malignant CTCL cell lines. (a) Decreased expression of miR-337 was observed in T cells from patients with CTCL (n = 30) compared to that in normal human T cells (n = 15). (b) miR-337 levels in malignant T cells and non-malignant cells, MySi and MyLa1850. MySi cells served as controls. Data are represented as mean ± SD. *P < 0.05, **P < 0.01. n = 3.
Figure 2. Effect of miR-337 mimic on the viability of malignant T cells. (a, b, c) Expression of miR-337 in MyLa2059, PB2B, and SeAx cells following transfection with the miR-337 mimic and NC miRNA, as measured by qPCR. (d, e, f) CCK-8 assay of three CTCL cells at 24, 48, and 72 h after transfection. (g, h, i) Proliferation of MyLa2059, PB2B, and SeAx cells after 48 h of transfection, as detected with BrdU incorporation assays. Data are represented as mean ± SD. *P < 0.05, **P < 0.01. n = 3.
Figure 3. miR-337 overexpression suppressed the invasion of malignant T cells. After miR-337 plasmid transfection, the invasion capacity of MyLa2059, PB2B, and SeAx cells was measured using a transwell migration assay (a, b, c) and the number of invasive cells was counted (d, e, f). Representative data are expressed as mean ± SD. *P < 0.05, **P < 0.01. n = 3.
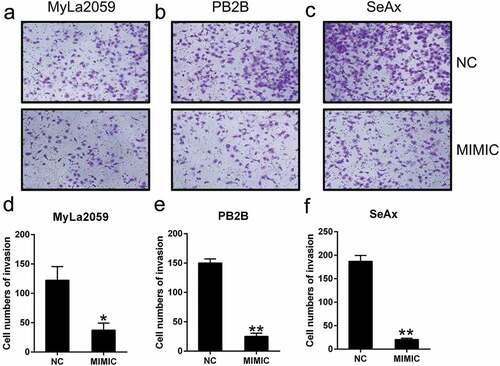
Figure 4. Ectopic overexpression of miR-337 enhanced apoptosis in CTCL cells. (a) Hoechst 33342 staining was carried out in each group of malignant T cells transfected with or without miR-337. Magnification, ×200. Apoptotic rate of positive Hoechst 33342 staining in each group of CTCL cells is displayed in the upper panel. (b) Annexin V-FITC/PI staining and flow cytometry was performed to evaluate the number of apoptotic cells. In the right panel, upper and lower quadrants of each plot represent early apoptotic cells. Apoptosis rate analysis of CTCL cells in each group is displayed in the lower panel. (c) miR-337 overexpression increased caspase-3/7 activity in the three CTCL cell lines (MyLa2059, PB2B, and SeAx). (d) Western blotting and (e, f) qPCR analyses were performed to assess the protein and mRNA levels, respectively, of Bcl-2 and Bax, which were regulated by miR-337 overexpression. Data are represented as mean ± SD. *P < 0.05, **P < 0.01 versus NC group. n = 3.
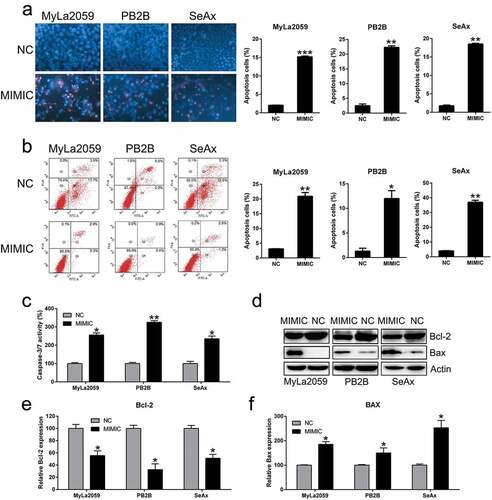
Figure 5. miR-337 directly targets STAT3. (a) An increase in STAT3 expression was observed in T cells from patients with MF (n = 20) compared to that in normal human T cells (n = 10). (b) STAT3 levels in malignant T cells (MyLa2059, PB2B, SeAx, and SeZ4.1) compared to those in non-malignant cells, MySi and MyLa1850. MySi cells served as the control. (c) Graphical representation of the conserved miR-337-binding motif at the 3′-UTR of STAT3. (d) Luciferase activity displayed by luciferase reporter constructs carrying either the 3′-UTR of the wild-type (WT) or mutant (MU) human STAT3 after miR-337 mimic transfection in 293T cells. Luciferase activity was normalized to the activity of β-galactosidase. The miR-337 mimic markedly decreased the relative luciferase activity of cells carrying the 3′-UTR WT but not in cells with the 3′-UTR MU. Western blotting (e, f, g) and qPCR (h, i, j) analyses were used to evaluate STAT3 protein and mRNA levels, respectively, after transfection of malignant T cells (MyLa2059, PB2B, SeAx) with the miR-337 mimic and NC miRNA. Data are represented as mean ± SD. *P < 0.05, **P < 0.01 versus normal group. n = 3.
Figure 6. STAT3 was artificially overexpressed in malignant T cells (MyLa2059, PB2B, SeAx) co-transfected with miR-337 mimic. MyLa2059, PB2B, and SeAx cells were co-transfected with miR-337 mimic and a STAT3-expressing vector. Western blotting (a, b, c) and qPCR (d, e, f) analyses were performed to confirm the ectopic expression of STAT3. Data are represented as mean ± SD. *P < 0.05, **P < 0.01 versus normal group. n = 3.
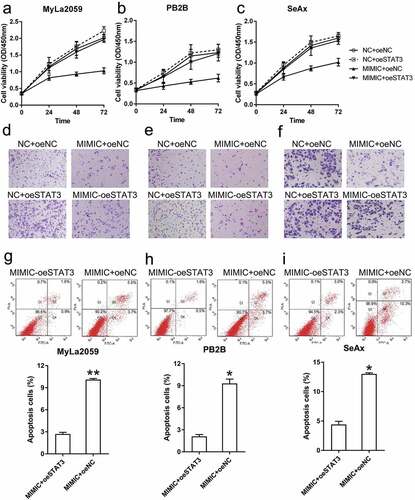
Figure 7. STAT3 overexpression restored the viability and invasion ability of malignant T cells and decreased their apoptosis. (a, b, c) The viability of three CTCL cells (with different transfection, NC+oeNC, NC+oeSTAT3, MIMIC+oeNC, and MIMIC+oeSTAT3) was measured with the CCK-8 assay at 24, 48, and 72 h post-transfection. (d, e, f) Invasion capacity of MyLa2059, PB2B, and SeAx cells (with different transfection, NC+oeNC, NC+oeSTAT3, MIMIC+oeNC, and MIMIC+oeSTAT3) was measured using a transwell migration assay. (g, h, i) Annexin V-FITC/PI flow cytometry was performed to detect the number of apoptotic cells in MyLa2059, PB2B, and SeAx cells subjected to different transfection treatments. Apoptotic cells are shown in the upper and lower right quadrants of each plot. Data represent the mean ± SD. *P < 0.05, compared with the indicated group. n = 3.