Figures & data
Figure 1. De novo synthesized lipids are directed to the nuclear envelope upon mitosis. Synchronized HeLa cells were incubated for 2 h (from G2/M) with [14C]acetate. Homogenates were centrifuged for 1 h at 170,000 g 4°C. A sucrose gradient was assembled with the resuspended pellet and centrifuged for 17 h at 100,000 g at 4°C. Fractions named 1 to 8 from top to bottom of the gradient were set-apart. An aliquot of the gradient fractions was used for Western Blot. Markers for plasma membrane (Na+/K+ ATPase), mitochondria (Tom 20), endoplasmic reticulum (ERp72) and nucleus (Histone H3) were assessed in each fraction. The percentage of each marker signal across the gradient was calculated (a). The remaining sample was used for lipid extraction. The lipid-associated radioactivity was quantitated by scintillation counting in each fraction (b).
![Figure 1. De novo synthesized lipids are directed to the nuclear envelope upon mitosis. Synchronized HeLa cells were incubated for 2 h (from G2/M) with [14C]acetate. Homogenates were centrifuged for 1 h at 170,000 g 4°C. A sucrose gradient was assembled with the resuspended pellet and centrifuged for 17 h at 100,000 g at 4°C. Fractions named 1 to 8 from top to bottom of the gradient were set-apart. An aliquot of the gradient fractions was used for Western Blot. Markers for plasma membrane (Na+/K+ ATPase), mitochondria (Tom 20), endoplasmic reticulum (ERp72) and nucleus (Histone H3) were assessed in each fraction. The percentage of each marker signal across the gradient was calculated (a). The remaining sample was used for lipid extraction. The lipid-associated radioactivity was quantitated by scintillation counting in each fraction (b).](/cms/asset/afd19a4b-a557-4e02-b5ad-41bfaa6f5463/kccy_a_1629792_f0001_b.gif)
Figure 2. Cellular distribution of choline at the mitotic exit. HeLa cells, synchronized by 2TB (a–d) or nocodazole (e–h), were incubated with 2 mM prop-Cho in complete media for 2 h (G2/M to G1 transition). The cells were fixed and reacted with 10 µM azide-Alexa488 (c and g). After counterstaining with Hoechst (b and f), the cells were imaged by fluorescence microscopy and phase contrast at 100X in an Olympus BX51 microscope. (a) and (e), bright field; (d) and (h), merged.
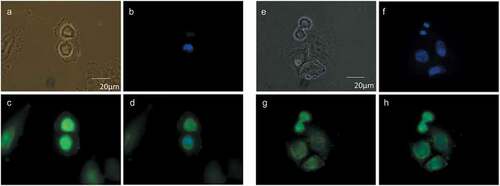
Figure 3. Choline containing lipids synthesized as the cells transverse mitosis colocalize with ER membrane marker. HeLa cells, synchronized by 2TB and released for 8 h, were incubated with 2 mM prop-Cho for 2 h. The cells were fixed and processed for immunofluorescence with Alexa 488-azide (b) and Alexa 647-conjugated concanavalin A (c) and analyzed by confocal microscopy (Olympus FV1000 microscope). (a) Hoechst staining; (d) merged.
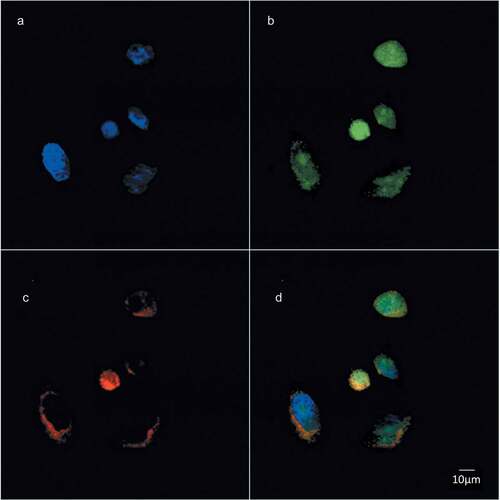
Figure 4. Choline containing lipids synthesized as the cells transverse mitosis colocalize with nuclear membrane marker. HeLa cells, synchronized by nocodazole, were incubated with 2 mM prop-Cho for 2 h. The cells were fixed and processed for immunofluorescence with Alexa 488-azide (a) and Cy3 conjugated anti-Mouse (for lamin A/C) (b) and analyzed by confocal microscopy (Olympus FV1000 microscope). (c) merged; (d) bright field.
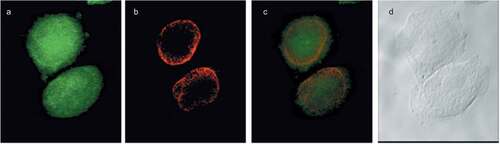
Figure 5. Impaired de novo PtdCho synthesis does not affect cell cycle progression. HeLa cells were transfected with siRNAs targeting CTα or a Non-Targeting pool (NT) at 10 nM for 48 h. The levels of CTα, Cyclin B1 and Vinculin were estimated by Western Blot (a). The level on CTα (b) and cell cycle distribution (d) were assessed in HeLa cells transfected with siRNA targeting CTα (hCTα4) or NT 10 nM for 48 h and incubated for 1 h with 10 μM BrdU. Alternatively, NT and hCTα4-siRNA transfected cells were incubated with [Methyl-3H]choline for 4 h. Aqueous metabolites were resolved by TLC and scrapped off and counted. CTα activity was estimated by the ratio of radiolabeled CDP-Choline/phospho-choline (c). Ct: untransfected cells.
![Figure 5. Impaired de novo PtdCho synthesis does not affect cell cycle progression. HeLa cells were transfected with siRNAs targeting CTα or a Non-Targeting pool (NT) at 10 nM for 48 h. The levels of CTα, Cyclin B1 and Vinculin were estimated by Western Blot (a). The level on CTα (b) and cell cycle distribution (d) were assessed in HeLa cells transfected with siRNA targeting CTα (hCTα4) or NT 10 nM for 48 h and incubated for 1 h with 10 μM BrdU. Alternatively, NT and hCTα4-siRNA transfected cells were incubated with [Methyl-3H]choline for 4 h. Aqueous metabolites were resolved by TLC and scrapped off and counted. CTα activity was estimated by the ratio of radiolabeled CDP-Choline/phospho-choline (c). Ct: untransfected cells.](/cms/asset/c0f2daee-c725-4036-8cb5-447cc8772836/kccy_a_1629792_f0005_oc.jpg)
Figure 6. Impaired lysophospholipid acylation does not cause cell cycle arrest at G2/M phase. (a) HeLa cells were incubated with CI-976 (lysophospholipid acyltransferases inhibitor) for 24 h in FBS-depleted media at 0, 0.02, 0.1, 0.5, 2.5 y 12.5 μM. Proliferation was estimated by Crystal Violet staining. (b) HeLa cells were incubated with 2.5 μM CI-976 o vehicle (0.01% DMSO) (without FBS) for 24 h. Two hours before harvesting the cells were incubated with [14C] LysoPtdCho −0.5% FA free BSA for 2 h. Total lipids were resolved by TLC and PtdCho and LysoPtdCho were scrapped off the plate and counted in by liquid scintillation counting. (c) Cell cycle profile and apoptosis (d) were estimated by flow cytometry or cleaved PARP (cPARP) and Cyclin B1 content by Western Blot, respectively after 24 h incubation with 2.5 μM CI-976. * p < 0.05 CI-976 vs control.
![Figure 6. Impaired lysophospholipid acylation does not cause cell cycle arrest at G2/M phase. (a) HeLa cells were incubated with CI-976 (lysophospholipid acyltransferases inhibitor) for 24 h in FBS-depleted media at 0, 0.02, 0.1, 0.5, 2.5 y 12.5 μM. Proliferation was estimated by Crystal Violet staining. (b) HeLa cells were incubated with 2.5 μM CI-976 o vehicle (0.01% DMSO) (without FBS) for 24 h. Two hours before harvesting the cells were incubated with [14C] LysoPtdCho −0.5% FA free BSA for 2 h. Total lipids were resolved by TLC and PtdCho and LysoPtdCho were scrapped off the plate and counted in by liquid scintillation counting. (c) Cell cycle profile and apoptosis (d) were estimated by flow cytometry or cleaved PARP (cPARP) and Cyclin B1 content by Western Blot, respectively after 24 h incubation with 2.5 μM CI-976. * p < 0.05 CI-976 vs control.](/cms/asset/02cac94b-df9a-4026-8dcc-5d5d47280f44/kccy_a_1629792_f0006_b.gif)
Figure 7. Simultaneous inhibition of PtdCho synthesis and lysophospholipid acylation induces apoptosis and G2/M arrest. HeLa cells were incubated with edelfosine at the indicated concentrations for 24 h. Total cell number and viability (a) were estimated in hemocytometer with Trypan Blue. Apoptosis and cell cycle distribution were assessed by Cyclin B1 levels by Western Blot (b) or flow cytometry (c). * p < 0.05 2.5 μM vs control.
Table 1. Combination index for etoposide and C75
Figure 8. Combined effect of etoposide and FASN impairment. Hela cells were treated with etoposide 80 μM for 24 h and the total cell number was estimated (a). The cells were incubated with etoposide and C75 at the concentrations shown in . The fraction affected and combination index were calculated as described under Methods (b). siRNA FASN or NT-transfected cells were incubated with etoposide 80 μM for 24 h and the FASN and cyclin B1 contents were assessed by Western Blot using vinculin as loading control.
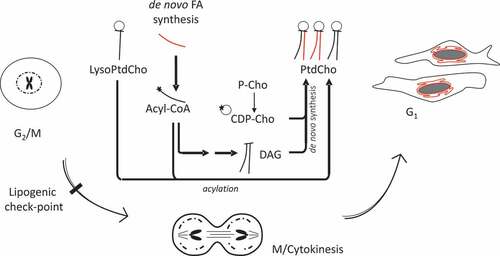
Figure 9. Working model.