Figures & data
Figure 1. Establishment of drug resistance MM cell lines. Drug-resistant cell lines (8266-BR and H929-BR) were established with two MM cell lines RPMI-8266 and H929 by the treatment of bortezomib with low doses to high doses. (a) Compared cell viability of normal cells and drug resistance cells in response to doses of bortezomib by using MTT assay. (b) Determination of MDR1 expression in normal cells and drug resistance cells by using western blot. **p < 0.01 compared with RPMI-8266 or H929.
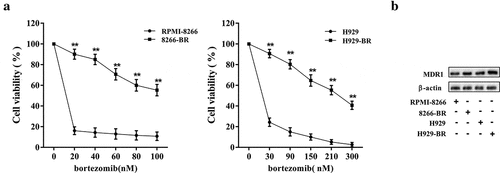
Figure 2. Profile of miRNAs in drug-resistant MM cell lines. (a) A series of MM-related miRNAs was detected in normal cells and drug resistance cells by using qRT-PCR. (b) Determination of APE1 and Rad51 expression in normal cells and drug-resistant cells. **p < 0.01 compared with RPMI-8266 or H929.
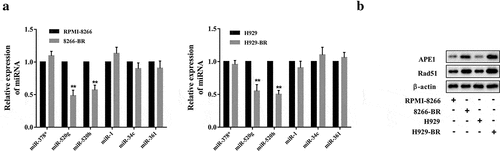
Figure 3. Co-effect of miR-520g and miR-520h on Rad51 expression. Normal RPMI-8266 or H929 cells were transfected with miR-520g/h inhibitor to knock down miR-520g/h. After 24h transfection, cells were collected for the analysis of (a) miR-520g/h expression level and (b) Rad51 protein expression level. Drug-resistant 8266-BR and H929-BR cells were transfected with miR-520g/h to overexpress miR-520g/h. After 24h transfection, cells were collected for the analysis of (c) miR-520g/h expression level and (d) Rad51 protein expression level.
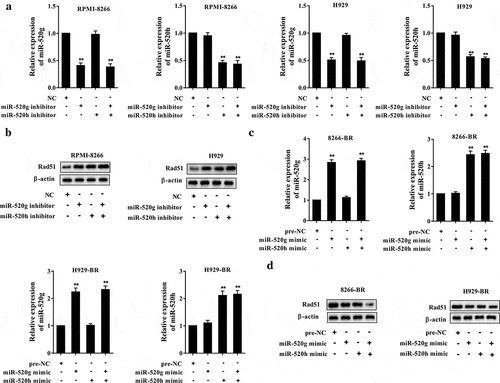
Figure 4. Co-effect of miR-520g/h on cell viability of (a) normal RPMI-8266 or H929 cells, and (b) drug-resistant 8266-BR and H929-BR cells in response to doses of bortezomib through MTT assay. *p < 0.05, **p < 0.01 compared with NC or pre-NC.
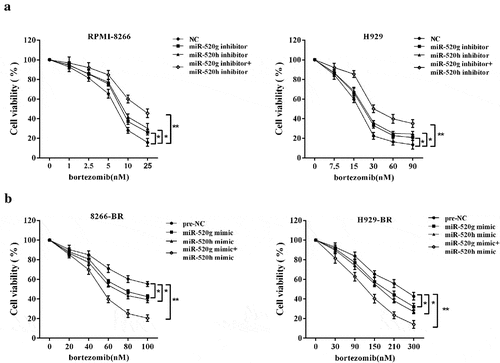
Figure 5. miR-520g and miR-520h target APE1. (a) Both miR-520g and miR-520h locate on chr19. (b) The paired binding site between miR-520g/h and APE1 mRNA 3ʹ-UTR. (c) Luciferase recombinant vector expressing target sequences of binding were co-transfected with miR-520g or miR-520h or both of miR-520g and miR-520h. Luciferase of cells was analyzed. Determination of APE1 protein level (d) in normal RPMI-8266 or H929 cells with miR-520g/h knockdown and in (e) drug-resistant 8266-BR and H929-BR cells with miR-520g/h overexpression. *p < 0.05, **p < 0.01 compared with pre-NC.
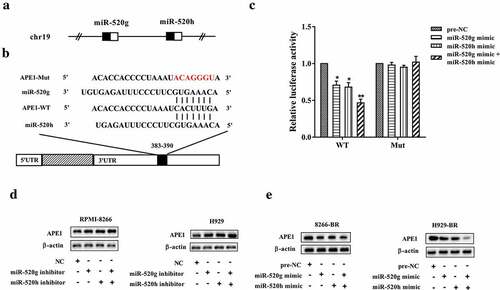
Figure 6. Determination of Rad51 protein level (a) in normal RPMI-8266 or H929 cells after co-knockdown of miR-520g/h and APE1 and (b) in drug-resistant 8266-BR and H929-BR cells after co-overexpression of miR-520g/h and APE1.
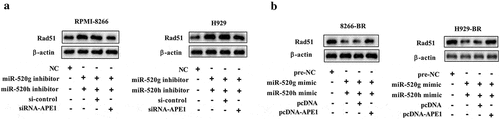
Figure 7. Effect of miR-520g/h-APE1 pathway in drug resistance of MM cells. Normal RPMI-8266 or H929 cells were transfected with both miR-520g/h inhibitor and siRNA-APE1 (shRNA interference for APE1) followed by treatment of bortezomib. After 24h, cells were collected for the analysis of (a) MDR1 protein expression level and (b) cell viability. Drug-resistant 8266-BR and H929-BR cells were transfected with both miR-520g/h and pcDNA-APE1 (recombinant pcDNA vector overexpressing APE1) followed by treatment of bortezomib. After 24h, cells were collected for the analysis of (c) MDR1 protein expression level and (d) cell viability. **p < 0.01 compared with NC or pre-NC. ##p < 0.01 compared with miR-520g/h inhibitor+si-control or miR-520g/h mimic+pcDNA.
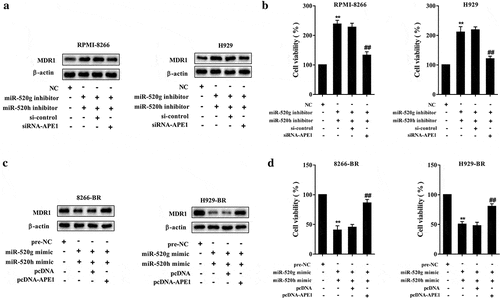
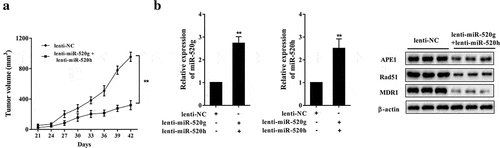
Figure 8. Effect of miR-520g/h overexpression on drug resistance of 8226-R5 xenograft tumor in SCID mice. Drug-resistant 8226-R5 cells that had been transfected with lentiviral vectors overexpressing miR-520g/h were subcutaneous transplanted into SCID mice. Xenograft tumor was injected with 0.5mg/kg bortezomib after tumor growing into 200-300 mm3. (a) Tumor volume was measured during 42 days. (b) The relative expression levels of miR-520g and miR-520h, and protein expression levels of APE1, Rad51, and MDR1 were determined in tumor tissues after 42 days. **p < 0.01 compared with lenti-NC.