Figures & data
Figure 1. GAK phosphorylates CHC in vitro. (A) A schematic representation of GST-tagged CHC divided into five fragments and relevant amino acid numbers. NTD, N-terminal domain. CHCR, clathrin heavy-chain repeat. Five fragments divided from CHC 2nd fragment was also shown. (B) GAK phosphorylates the second CHC fragment, as detected by in vitro kinase assays. A radio-autograph of the SDS-PAGE gel after in vitro kinase assays using the indicated fragments (top panel) shows a strong band only with the second CHC fragment (red arrowhead). The green arrow indicates the band corresponding to auto-phosphorylated GAK. CBB staining (bottom panel) of the same SDS-PAGE gel to show the presence of the band at the same location. (C) GAK phosphorylates part #3 of the second CHC fragment, as detected by in vitro kinase assays. A radio-autograph of the SDS-PAGE gel after in vitro kinase assays using the indicated fragments (top panel) shows a strong band only with part #3 of the second CHC fragment (red arrowhead). The green arrow indicates the band corresponding to auto-phosphorylated GAK. CBB staining (bottom panel) of the same SDS-PAGE gel to show the presence of the band at the same location. (D) A schematic representation of part #3 of the second CHC fragment, in which the indicated T residue was replaced by A (red font). (E) A radio-autograph (top) and CBB staining (bottom) of the SDS-PAGE gel after in vitro kinase assays with GAK using WT fragment (167 amino acids) and the five regions (see Figure 1D) of part #3 of the second CHC fragment. Black arrows, green arrowheads and red arrowhead, indicate strongly phosphorylated, weakly phosphorylated and non-phosphorylated bands, respectively. A middle panel shows a part (27–35 kDa) of the enhanced image of radio-autograph. (F) Wb to demonstrate the successful construction of Tet-ON HeLa S3 cells expressing Myc-vector, Myc-CHC_WT, Myc-CHC_T606A, or Myc-CHC_T606D. α-tubulin was detected as a loading control.
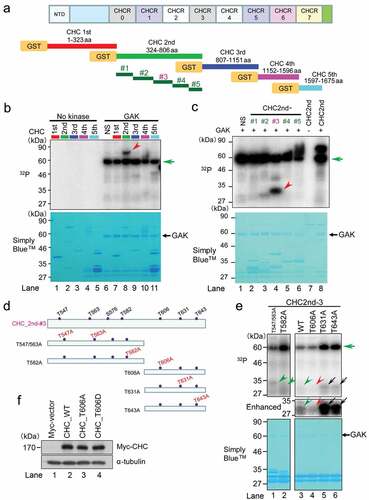
Figure 2. Phosphorylation of CHC-T606 is required for proper cell growth rates. (A) The growth rates of HeLa S3 cells expressing Myc-vector or Myc-CHC_T606A were slower than those of cells expressing Myc-CHC_WT or Myc-CHC_T606D in the presence of Dox (+). (B) HeLa S3 cells expressing Myc-CHC_T606A or Myc-CHC_WT were subcutaneously implanted into the lateral back of nude mice. The line graph shows the tumor volume measured using a caliper square at the indicated date. Dox was intraperitoneally administered at the indicated timings (red arrows). (C) Typical images of mice harboring tumors in the lateral back at the indicated date.
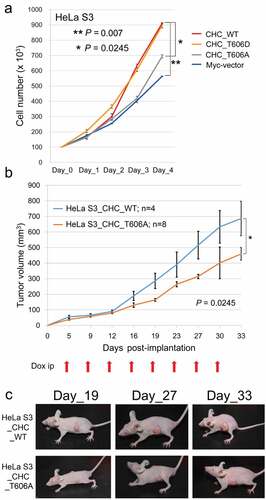
Figure 3. CHC-pT606 signals are observed in the nucleus during interphase and at the centrosome during M phase. (A) Subcellular localizations of CHC-pT606 and CHC during the cell cycle. IF analysis of HeLa S3 cells was performed using an anti-CHC-pT606 polyclonal Ab and an anti-CHC monoclonal Ab. Typical IF images at interphase and M phase are shown at different stages of the cell cycle. Contrast-enhanced images of CHC-pT606 and CHC signals are also shown in the rightmost panels. Yellow arrowheads and red arrows indicate the putative localizations of these signals at the centrosome and mitotic spindle, respectively. White arrows at metaphase indicate the localization of CHC-pT606 signals at mitotic spindle. (B) Co-localization of CHC-pT606 with γ-tubulin suggests that it localized at the centrosome. (C) Co-localization of CHC-pT606 with a part of CHC at the centrosomes in mitotic HeLa S3 cells fixed with formaldehyde (FA) and methanol (MeOH). DNA was counter-stained with Hoechst33258 to detect chromatin. (D) High-magnification images of the cells shown in C highlight the partial co-localizations of CHC-pT606 and CHC (white arrows) at asters during metaphase. (E) Enlarged images show that CHC-pT606 (white arrowheads) and CHC (pink arrowheads) signals co-localize primarily at the tips of mitotic spindle MTs. (F–H) Typical IF images of cells during interphase and M phase following siRNA-mediated knockdown using siGL2 (F, top panel in H) or siCHC (G, bottom panel in H). DNA was counter-stained with Hoechst33258 to detect chromatin. Yellow arrowheads indicate localization at the centrosome. Bars, 10 µm.
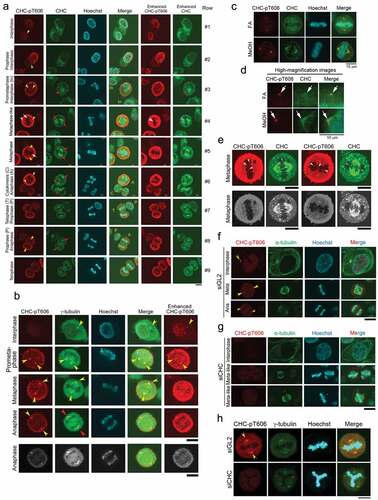
Figure 4. siRNA-mediated knockdown of GAK perturbs the localization of CHC-pT606.
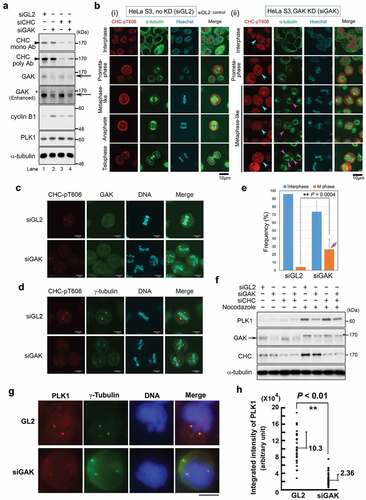
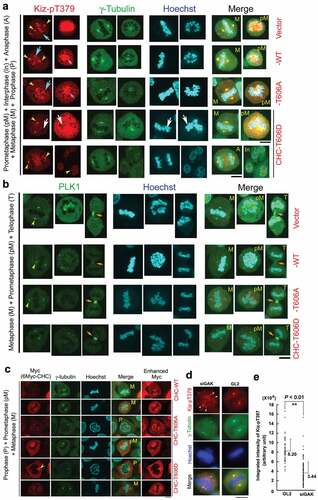
Figure 5. GAK, CHC, PLK1, and Kiz form a complex during M phase. (A) Co-IP showing the association of Myc-PLK1 and Flag-GAK. An anti-Myc Ab (i) or an anti-Flag Ab (ii) was used for immunoprecipitation. (B) Co-IP showing the association of Flag-PLK1 with Myc-GAKΔK (full-length GAK without the kinase domain, 170 kDa), but not with Myc-GAK-K (kinase domain alone, 60 kDa). The arrowhead indicates a band reflecting the preferential association of Flag-PLK1 with Myc-GAKΔK. Arrows indicate the bands corresponding to Myc-GAKΔK, Myc-GAK-K, and Myc. (C, D) Subcellular localizations of Kiz-pT379 and PLK1 in HeLa S3 cells at interphase and during M phase after siRNA-mediated knockdown (KD) using siGL2 (C) or siGAK (Ki9) (D). Yellow arrowheads indicate the centrosome. Turquoise, pink, and orange arrows indicate chromatin, the central region of the spindle, and the midbody, respectively. DNA was counter-stained with Hoechst33258 to detect chromatin. Bars, 10 µm.
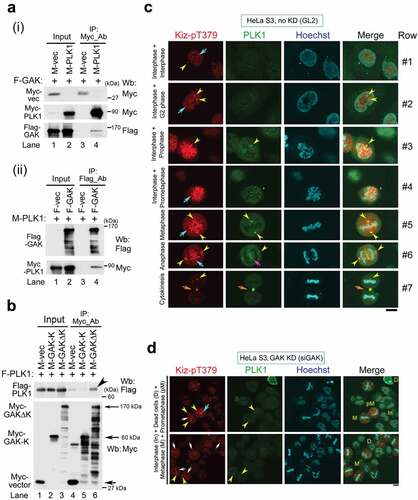
Figure 6. The localization of Kiz-pT379 on chromatin at metaphase is perturbed in HeLa S3 cells expressing Myc-CHC_T606D. (A, B, C) Typical IF images of Tet-ON inducible HeLa S3 cells expressing Myc-vector, Myc-CHC_WT, Myc-CHC_T606A, or Myc-CHC_T606D at interphase and during M phase. Cells were labeled with anti-Kiz-pT379 (A), anti-γ-tubulin (A, C), anti-PLK1 (B), and anti-Myc (C) Abs. DNA was counter-stained with Hoechst33258 to detect chromatin. Yellow arrowheads, turquoise arrows, and orange arrows indicate Kiz-pT379 signals at the centrosome, chromatin, and midbody, respectively. Pink arrows indicate co-localized Kiz-pT379 and chromatin signals. White arrows in Myc-CHC_T606D-expressing cells indicate the absence of Kiz-pT379. Scale bars, 10 µm. (D) Representative images of Kiz-pT379 immunofluorescence in GL2- and siGAK-treated cells. The scattered γ-tubulin foci (more than two) were merged with the Kiz-pT379 foci (white arrowheads). Scale bars, 10 µm. (E) Comparison of Kiz-pT379 signal intensity at the centrosome of GL2- and siGAK-treated cells using Metaview software. Integrated intensities of GL2-treated Kiz-pT379 dot foci (n = 50) and siGAK-treated Kiz-pT379 dot foci (n = 210) were scored. The dot graphs in (E) show the average + SE values of these measurements. All measurements are statistically significant when GL2 and siGAK are compared (P < 0.01).