3,012
Views
18
CrossRef citations to date
0
Altmetric
Research Paper

Vitamin B1 and B12 mitigates neuron apoptosis in cerebral palsy by augmenting BDNF expression through MALAT1/miR-1 axis

, , , , , , & show all
Pages 2849-2859 | Received 28 Aug 2018, Accepted 14 May 2019, Published online: 10 Sep 2019

Figures & data

Figure 1. Vitamin B1 and B12 introduced by HA ameliorated nerve injury in cerebral palsy rats. Rats were allocated into three groups (n = 6): Sham, CP, CP+HA. (a) The motor and memory functions of rats were evaluated by Rota-rod test and Step-down avoidance task, respectively; the NSE level was detected by ELISA. (b) The expression of lncRNAs including MALAT1 in hippocampus tissues was quantified by qRT-PCR. (c) The expression level of miR-1, BDNF mRNA and protein in hippocampus tissues was analyzed by qRT-PCR and western blot, respectively. *P < 0.05 compared with sham; #P < 0.05 compared with CP.
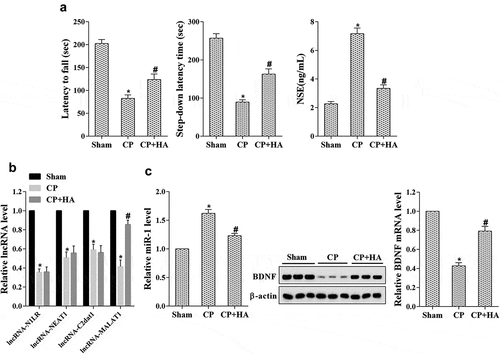
Figure 1. Vitamin B1 and B12 introduced by HA ameliorated nerve injury in cerebral palsy rats. Rats were allocated into three groups (n = 6): Sham, CP, CP+HA. (a) The motor and memory functions of rats were evaluated by Rota-rod test and Step-down avoidance task, respectively; the NSE level was detected by ELISA. (b) The expression of lncRNAs including MALAT1 in hippocampus tissues was quantified by qRT-PCR. (c) The expression level of miR-1, BDNF mRNA and protein in hippocampus tissues was analyzed by qRT-PCR and western blot, respectively. *P < 0.05 compared with sham; #P < 0.05 compared with CP.

Figure 2. The expression of MALAT1 in OGD/R induced N2A neurons was increased by vitamin B1 and B12. To evaluate the effect of vitB on MALAT1 expression and which levels of vitB were suitable in N2A cells, OGD/R and VitB at different concentrations were introduced to allocate into six groups: control, OGD/R, OGD/R + 1 μM VitB, OGD/R + 2.5 μM VitB, OGD/R + 5 μM VitB, and OGD/R + 7.5 μM VitB. (a) The expression of MALAT1 in N2A cells was detected by qRT-PCR. (b, c) The expression level of miR-1, BDNF mRNA and protein in N2A cells was determined by qRT-PCR and western blot, respectively. *P < 0.05 compared with control; #P < 0.05 compared with OGD/R; &P < 0.05 compared with 1μM; $P < 0.05 compared with 2.5μM.
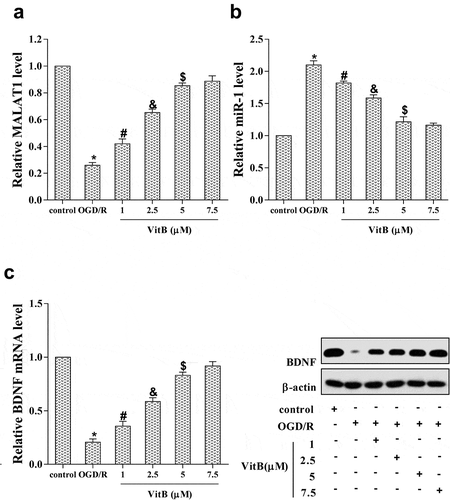
Figure 2. The expression of MALAT1 in OGD/R induced N2A neurons was increased by vitamin B1 and B12. To evaluate the effect of vitB on MALAT1 expression and which levels of vitB were suitable in N2A cells, OGD/R and VitB at different concentrations were introduced to allocate into six groups: control, OGD/R, OGD/R + 1 μM VitB, OGD/R + 2.5 μM VitB, OGD/R + 5 μM VitB, and OGD/R + 7.5 μM VitB. (a) The expression of MALAT1 in N2A cells was detected by qRT-PCR. (b, c) The expression level of miR-1, BDNF mRNA and protein in N2A cells was determined by qRT-PCR and western blot, respectively. *P < 0.05 compared with control; #P < 0.05 compared with OGD/R; &P < 0.05 compared with 1μM; $P < 0.05 compared with 2.5μM.

Figure 3. Vitamin B1 and B12 reduced miR-1 expression in OGD/R induced N2A neurons through up-regulating MALAT1. (a) To evaluate which miRNA was affected by vitB, N2A cells were assigned into three groups: control, OGD/R, OGD/R+ VitB (5μM). The level of miR-140, miR-141, miR-142, miR-150, miR-155, and miR-1 in N2A cells was evaluated using qRT-PCR. (b) N2A cells were then divided into five groups via different treatments: control, OGD/R, OGD/R+ VitB (5μM), OGD/R+ VitB+si-control, and OGD/R+ VitB+si-MALAT1. The expression of miR-1 in N2A cells of different groups was examined by qRT-PCR. *P < 0.05 compared with control; #P < 0.05 compared with OGD/R; &P < 0.05 compared with the OGD/R+ VitB+si-control group.
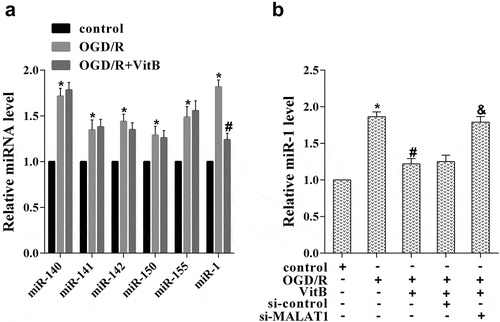
Figure 3. Vitamin B1 and B12 reduced miR-1 expression in OGD/R induced N2A neurons through up-regulating MALAT1. (a) To evaluate which miRNA was affected by vitB, N2A cells were assigned into three groups: control, OGD/R, OGD/R+ VitB (5μM). The level of miR-140, miR-141, miR-142, miR-150, miR-155, and miR-1 in N2A cells was evaluated using qRT-PCR. (b) N2A cells were then divided into five groups via different treatments: control, OGD/R, OGD/R+ VitB (5μM), OGD/R+ VitB+si-control, and OGD/R+ VitB+si-MALAT1. The expression of miR-1 in N2A cells of different groups was examined by qRT-PCR. *P < 0.05 compared with control; #P < 0.05 compared with OGD/R; &P < 0.05 compared with the OGD/R+ VitB+si-control group.

Figure 4. Vitamin B1 and B12 affected BDNF and PI3K/Akt pathway through MALAT1/miR-1 axis. N2A cells were allocated into seven groups: control, OGD/R, OGD/R+ VitB (5μM), OGD/R+ VitB+si-control, OGD/R+ VitB+si-MALAT1 (20μM), OGD/R+ VitB+si-MALAT1+ NC, and OGD/R+ VitB+si-MALAT1+ miR-1 inhibitor. (a) The expression of miR-1 in N2A cells of different groups was assessed with qRT-PCR. (b) The protein level of p-PI3K, PI3K, p-Akt, Akt, and BDNF in N2A cells was determined using western blot. *P < 0.05 compared with control; #P < 0.05 compared with OGD/R; &P < 0.05 compared with the OGD/R+ VitB+si-control group; $P < 0.05 compared with the OGD/R+ VitB+si-MALAT1+ NC group.
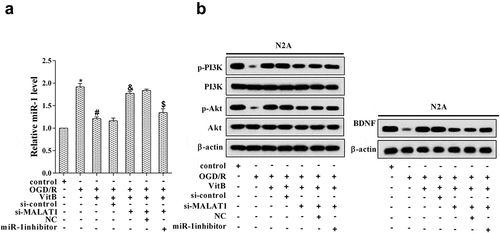
Figure 4. Vitamin B1 and B12 affected BDNF and PI3K/Akt pathway through MALAT1/miR-1 axis. N2A cells were allocated into seven groups: control, OGD/R, OGD/R+ VitB (5μM), OGD/R+ VitB+si-control, OGD/R+ VitB+si-MALAT1 (20μM), OGD/R+ VitB+si-MALAT1+ NC, and OGD/R+ VitB+si-MALAT1+ miR-1 inhibitor. (a) The expression of miR-1 in N2A cells of different groups was assessed with qRT-PCR. (b) The protein level of p-PI3K, PI3K, p-Akt, Akt, and BDNF in N2A cells was determined using western blot. *P < 0.05 compared with control; #P < 0.05 compared with OGD/R; &P < 0.05 compared with the OGD/R+ VitB+si-control group; $P < 0.05 compared with the OGD/R+ VitB+si-MALAT1+ NC group.

Figure 5. Vitamin B1 and B12 participated in neuron apoptosis via the MALAT1/miR-1/BDNF/PI3K/Akt pathway. N2A cells were grouped according to different treatments: control, OGD/R, OGD/R+ VitB (5μM), OGD/R+ VitB+si-control, OGD/R+ VitB+si-MALAT1, OGD/R+ VitB+si-MALAT1+ NC, OGD/R+ VitB+si-MALAT1+ miR-1 inhibitor, and OGD/R+ VitB+si-MALAT1+ miR-1 inhibitor+LY294002 (inhibitor of PI3K/Akt pathway). (a) Neuron apoptosis was estimated using TUNEL staining. (b) The level of cleaved-capase3 was analyzed by western blot. *P < 0.05 compared with control; #P < 0.05 compared with OGD/R; &P < 0.05 compared with the OGD/R+ VitB+si-control group; $P < 0.05 compared with the OGD/R+ VitB+si-MALAT1+ NC group; %P < 0.05 compared to the OGD/R+ VitB+si-MALAT1+ miR-1 inhibitor group.
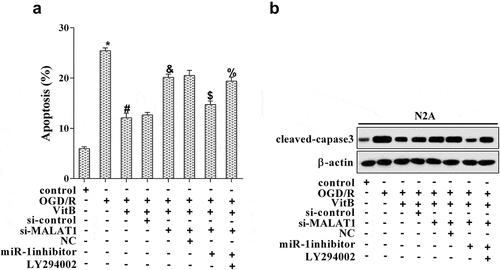
Figure 5. Vitamin B1 and B12 participated in neuron apoptosis via the MALAT1/miR-1/BDNF/PI3K/Akt pathway. N2A cells were grouped according to different treatments: control, OGD/R, OGD/R+ VitB (5μM), OGD/R+ VitB+si-control, OGD/R+ VitB+si-MALAT1, OGD/R+ VitB+si-MALAT1+ NC, OGD/R+ VitB+si-MALAT1+ miR-1 inhibitor, and OGD/R+ VitB+si-MALAT1+ miR-1 inhibitor+LY294002 (inhibitor of PI3K/Akt pathway). (a) Neuron apoptosis was estimated using TUNEL staining. (b) The level of cleaved-capase3 was analyzed by western blot. *P < 0.05 compared with control; #P < 0.05 compared with OGD/R; &P < 0.05 compared with the OGD/R+ VitB+si-control group; $P < 0.05 compared with the OGD/R+ VitB+si-MALAT1+ NC group; %P < 0.05 compared to the OGD/R+ VitB+si-MALAT1+ miR-1 inhibitor group.

Figure 6. Down-regulation of MALAT1 abolished the neuroprotective effect of HA-introduced vitamin B1 and B12 in cerebral palsy rats. Rats were randomly allocated into several groups (n = 6 in each group): Sham, CP, CP+HA-VitB, CP+HA+si-control, and CP+HA+si-MALAT1. (a) The motor and memory functions of rats were evaluated by Rota-rod test and Step-down avoidance task, respectively; the NSE level was detected by ELISA. (b) The expression of MALAT1, miR-1, and BDNF mRNA in hippocampus tissues was quantified with qRT-PCR; the level of BDNF protein in hippocampus tissues was analyzed by western blot. *P < 0.05 compared with sham; #P < 0.05 compared with CP.
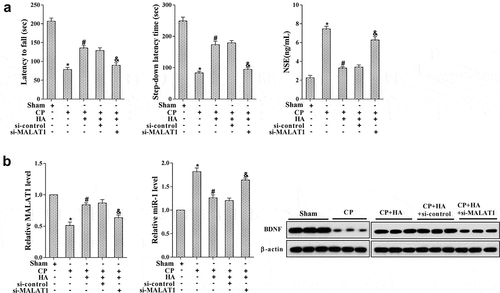
Figure 6. Down-regulation of MALAT1 abolished the neuroprotective effect of HA-introduced vitamin B1 and B12 in cerebral palsy rats. Rats were randomly allocated into several groups (n = 6 in each group): Sham, CP, CP+HA-VitB, CP+HA+si-control, and CP+HA+si-MALAT1. (a) The motor and memory functions of rats were evaluated by Rota-rod test and Step-down avoidance task, respectively; the NSE level was detected by ELISA. (b) The expression of MALAT1, miR-1, and BDNF mRNA in hippocampus tissues was quantified with qRT-PCR; the level of BDNF protein in hippocampus tissues was analyzed by western blot. *P < 0.05 compared with sham; #P < 0.05 compared with CP.