Figures & data
Figure 1. Cell cycle state of individual neural progenitors is programmed by other cells in the population.
(a) Synchronized clusters of migratory Ki-67+ and Ki67− cells (top left, dotted lines) can either form by random localization of cells that are in the same phase of cycle or by de novo synchronization subsequent to clustering (top left scale bar: 40μm, top middle scale bar: 20μm). Live- imaging analysis by application of Fucci reporter dye shows de novo synchronization by reversal of the cell cycle directionality of an individual cell (white arrow) in order to adapt to a cluster of G1-Synchronized cells (red nuclei). In the absence of clustering, cell cycle progresses in the expected direction (turquoise arrow). Timestamps are in minutes. (b)Synchronized clusters convene at G1 by two parallel mechanisms. Cells that are in G2 regress to G1 and cells that are at G1 dwell longer in this phase by regression to G0 (timestamp unit = 50 min; scale bar: 10μm). (c) Line graph shows the cumulative incidence of reverse cycling detected by Fucci reporter dye. The two grey lines indicate the total number of cells at t = 0 (n = 340 cells) and t = 1000 min (n = 400 cells). (d) The majority of the organoid cells synchronize to early G1 within 16 h. Note the depletion of cytoplasmic β-catenin (CTNNB1), a major driver of the cell cycle, by recruitment into intercellular junctions (N-cadherin). In the outermost layer, where intercellular contacts are diminished, β-catenin becomes detectable in the cytoplasm. ERBB2 (Her2) is a major inhibitor of GSK3β and hence rescues β-catenin that is subsequently recruited to junctional complexes (top left scale bar: 120μm, top right scale bar: 40μm, bottom scale bars: 60μm). M: Mantle layer; OC: outer core cells; IN: inner core cells.
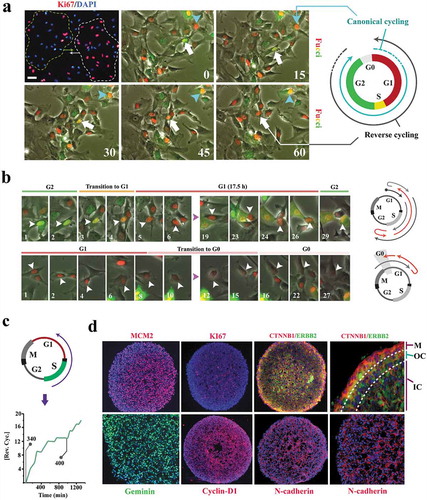
Figure 2. Reprogramming of coupled cycling using small molecule inhibitors.
(a) Schematic image shows the molecular basis for modulating subcellular localization of β-catenin in order to program coupled cycling. Note that the application of a coupling enhancer (IWR1) triggers the depletion of active nuclear catenin-β1 (catenin-β1act.) by recruitment into the junctional complexes. Application of a coupling suppressor (ML141) induces the opposite signature (scale bar: 20μm). (b) Ki-67 and MCM2 report the synchronization state of neural progenitors subsequent to the application of coupling enhancers (BIO and IWR1) and a coupling repressor (ML141) (scale bar: 60μm). (c) Ki-67 immuno-reactivity (n = 15 fields) suggests Synchronization of uncoupled cells (ML141+) at late G1 as opposed to G0 Synchronization coupled IWR1+ cells. Fucci reporter dye confirmed the proposed state of cycle subsequent to the application of inhibitors (scale bar: 35μm). ** indicates p < 0.01. (d) Schematic demonstration of molecular signature that characterizes G0 (early G0), G0ˊ (late G0), and G1. (e)Electron micrographs demonstrate autophagosome formation (blue) in IWR-1+ cells. Note the enhanced endocytosis (purple granules) in ML141+ cells due to destabilized junctional complexes subsequent to the inhibition of CDC42. Analysis of autophagic flux by RFP/GFP‐tagged LC3 reporter plasmid, ptfLC3, confirmed ultrastructural findings (top scale bar: 0.4 μm, middle scale bar: 5μm, bottom scale bar: 45μm). Note that autophagic flux in simulated coupling (IWR+, BIO+) increases. In Bio+ cells autophagy is highly active (RFP+/GFP−).
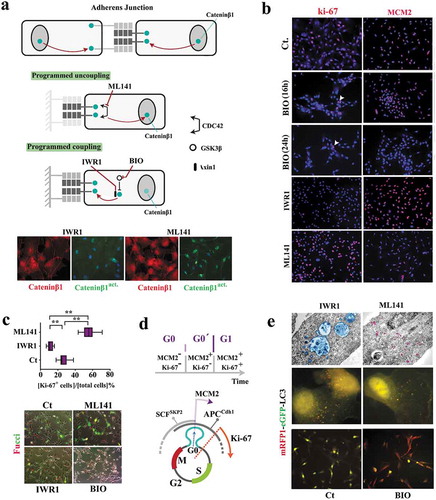
Figure 3. Kuramoto model accurately predicts coupling dynamics of the cycling neural progenitors.
(a) Simulated emergence of synchronized cell divisions under instruction from a weak coupler. Phase angle (y-axis) represents the progress of progenitor cells (n =150 cells) through an abstract cell cycle with reference to the forthcoming mitosis that occurs at phase angle = 2Π (see methods for details). As such, the coupler instructs emergence of complete phase locking (full synchronization) at t = 1300 min. from the random distribution of phase angles (uncoupled/non- synchronized state) at t = 0. In this timeframe, the partial synchronization that occurs at t = 700 is compatible with the in vitro synchronization signature of progenitor cells. (b)The left panel shows the cumulative incidence of cell division (blue line) and the associated regression line (dotted grey line, fˊ = slope of the regression line). Phase contrast image shows an example of synchronized divisions (blue arrows) that generate positive deviations of mitotic incidence from linearity. Such deviations from linearity of cell division (mitotic residuals: mitotic res.) are in vitro signatures of coupled cycling (top right). The in vitro signature is accurately simulated by Kuramoto model of synchronization (bottom right, t = 700 as explained in part a). (c) Representative temporal signatures of mitotic synchronicity subsequent to increased (IWR1) and decreased (ML141) stringency of coupling were developed by application of inhibitors at a concentration of 100 nM (see methods). (d) Simulated emergence of synchronicity after increased (top left) and decreased (top right) coupling stringency that occurs at t = 1000 min (pink ribbon, kˊ indicates the altered coupling constant). The synchronicity profiles compatible with the in vitro signatures were observed at t1 (100 min. after the enhanced coupling) and t2 (750 min. after uncoupling). Biological interpretations of the simulated profiles of synchronicity are found next to the emergence plots.
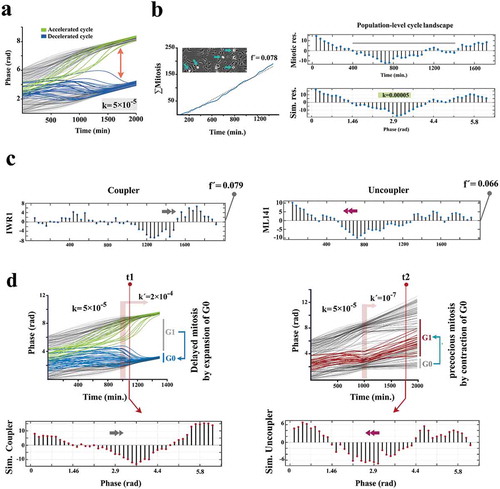
Figure 4. Sub-lineage fate specification of neural progenitors is programmed by coupling dynamics of the population.
(a) ML141+ neural progenitors demonstrate a glial differentiation bias (NeuN−, Nestin−, Glutamine synthase+ (GS+), top). IWR1+ cells demonstrate neuronal differentiation bias that is offset by simultaneous application of ML141. BIO+ cells (synchronized at G0) remain quiescent (Nestin+, Dcx−, atoh1high, mash1high) subsequent to the induction of differentiation and this state is not counterbalanced by simultaneous application of ML-141 (top left scale bar: 55μm, top middle scale bar: 45μm, top right scale bar: 20μm). The expression level of genes of interest are normalized β-actin and referenced to the control group (n = 3 biological replicates). * indicates p < 0.05 and ** indicates p < 0.01. (b) In neural organoids, inner core cells are mainly Nestin+. The cells in the outer core are NeuN+ and those in the mantle layer are S100+/VEGF+ (scale bar: 120μm). Note the radial polarity of NeuN+ cells as opposed to the the axial polarity of S100+/VEGF+ pro-glial cells. (c) Expression of Ki-67 in various treatment groups (n = 15 fields) after the induction of differentiation (scale bar: 55μm). ** indicates p < 0.01.
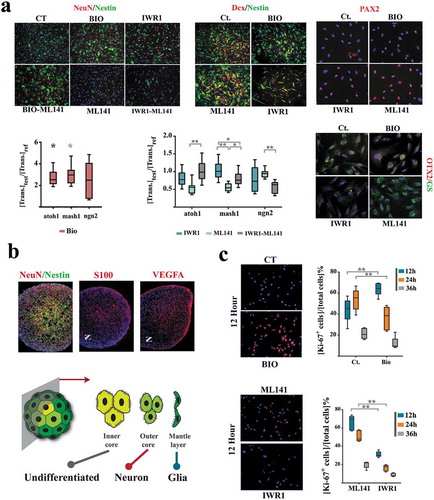
Figure 5. Spatial self-organization of organoids is programmed by coupling dynamics of the population.
(a) To uncover cell cycle-mediated modulation of intercellular communication cues, cells were initially synchronized at G0 by serum starvation and forced into G1 by adding serum. Graphs demonstrate the levels of gene expression normalized to t0 (serum starvation) (n = 3 biological replicates). Turquoise line: mean value, grey ribbon: ±SEM. (b) Box plots demonstrate the levels of expression genes that regulate intercellular communication cues in neural organoids (Og) and BIO+ cells, both normalized to cells in a serum-starved mode (SS) for 24 h. Note that organoid cells (synchronized at G0ˊ) express a higher level of these transcripts analogous to t = 30 min in part a when cells progress into G0ˊ from G0 by addition of serum to the starved cells. (c)A representative organoid shows the radial organization of BIO+ and IWR1+ cells. Wheat germ agglutinin-Alexa594 was used to label BIO-treated cells and Hoechst labeled the cells treated with IWR1 (top left scale bar: 100μm, top right scale bar: 25μm). High magnification image (right image) shows an optical slice of the organoid captured using confocal microscopy. (d)A representative organoid shows the polarised organization of BIO+ and ML141+ cells. Wheat germ agglutinin- Alexa594 was used to label BIO- treated cells and Hoechst labeled the cells treated with ML141 (top left scale bar: 100μm, top right scale bar: 50μm). High magnification image (right image) shows two optical slices of the organoid (1: top, 2: bottom of the organoid) captured using confocal microscopy.
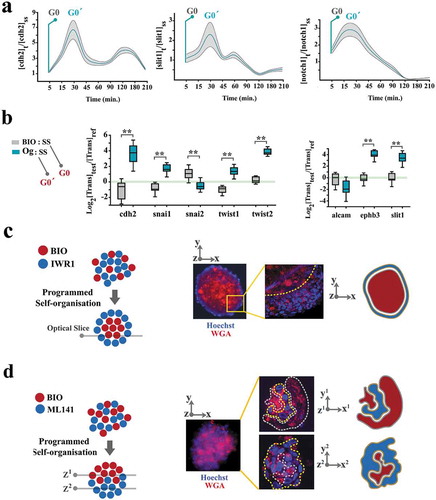
Figure 6. The cell cycle is key to the self-organization of neural progenitors.
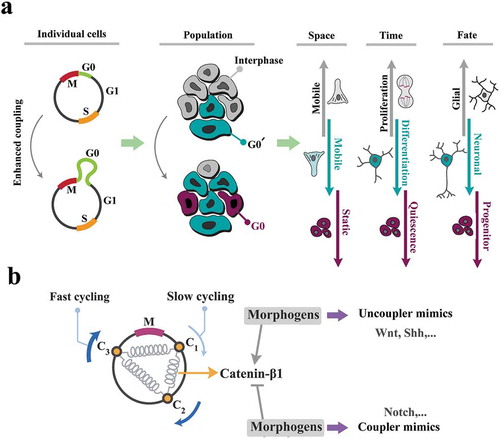
(a) Enhanced coupling stringency leads to amplification of G0/G0ˊ phases of cell cycle and subsequent- synchronized progression into interphase at a population level. The very same siganture, at an individual cell level, instructs spatial navigation, proliferation, and fate specification biases. As such, increased coupling stringency improves synchronicity of the cycling cells by decelerating the cell cycle and in parallel, delays differentiation. Upon differentiation, the same mechanism induces neuronal fate bias. Uncoupling instructs the opposite phenotype. (b) Morphogenes may be interpreted as the enhancers or the suppressors of coupling strength (schematized as springs) in order to synchronize/desynchronize the population and invoke the morphogenic signatures.