Figures & data
Figure 1. Loss of TAp73 expression in MIBC is associated with lower overall survival.
Primary tumor samples from 338 bladder cancer patients were stained for TAp73 expression and analyzed using Aperio ScanScope. Protein expression was defined by H-scores, calculated as described in materials and methods. (a) Immunohistochemical staining showing representative images with positive and negative staining of TAp73. (b&c) Tap73 H-scores based on grade or phenotype. (d&e) Kaplan-Meier plot of overall and disease-specific survival in individuals stratified into quartiles (High > 16.1, 1.06 ≤ Intermediate ≤ 16.1, Low < 1.06) based on TAp73 H-scores. Clinicopathological characteristics of this patient cohort are detailed in Supplementary Table 1.
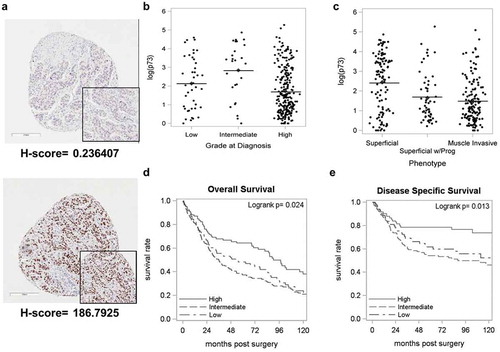
Figure 2. p73 promoter is frequently hypermethylated in muscle-invasive bladder cancer.
Tumor and adjacent tissue with no evidence of disease were interrogated using Illumina 450K DNA methylation array. (a) Representative image showing CpG sites analyzed by Illumina array and pyrosequencing (in circles). Exons coding regions are displayed as numbered boxes. Box plots of average methylation pattern in individual MIBC patients. Beta values of average methylation interrogated across (b) 12 CpG sites, (c) 9 CpGs in P1 and (d) 1 CpG in P2.
Figure 3. High promoter methylation in patients is associated with poor survival outcome.
(a&b) Kaplan-Meier survival analysis with high methylation (solid line) and low methylation (dashed line) in patients after cisplatin treatment. (c&d) Kaplan-Meier survival analysis with high methylation (solid line) and low methylation (dashed line) in patients after chemotherapy.
Figure 4. Decitabine decreases TAp73 promoter methylation and increases expression.
Cells were treated with 0, 1, or 5 µM DAC. Total RNA, DNA, and protein nuclear extracts were harvested at 48h. (a&b) P1 and P2 promoter methylation was analyzed using pyrosequencing following DAC treatment. Average methylation across the interrogated CpG sites is represented. (c&d) TAp73 and ∆Np73 mRNA expression levels following treatment. Results are the mean ± SEM of the relative expression level to GAPDH. (e) qPCR products on agarose gel after DAC treatment in 253J cells. (f) TAp73 and DNMT1 protein levels after DAC treatment with Histone H3 as a loading control. *p < 0.05, **p < 0.01, ***p < 0.001.
Figure 5. Pretreatment with decitabine sensitizes T24 cells to cisplatin.
(a-i) T24 cells were pretreated with 2 µM DAC for 48 hours, followed by 0.5 µg/mL cisplatin treatment. Total RNA, DNA, and protein nuclear extracts were harvested at 24 hours following cisplatin treatment. (a&b, f&g) Promoter P1, P2 methylation was analyzed using pyrosequencing in T24 and CR-T24 cells respectively. Average methylation across the interrogated CpG sites following treatment is represented. (c&d, h&i) TAp73 and ∆Np73 mRNA expression levels after treatment in T24 and CR-T24 cells respectively. Results are the mean ± SEM of the relative expression level to GAPDH. (e)TAp73 and DNMT1 protein level were evaluated using immunoblot analysis, using Histone H3 as a loading control. (j&k) T24 and CR-T24 cells were subjected to in vitro clonogenic assay. Cells were pretreated with 0.5 µM DAC for 48 hours, followed by 0.25 µg/mL cisplatin (T24) or 1µg/mL cisplatin (CR-T24) treatment for 24 hours. Colonies were stained with crystal violet after an incubation period of 10 days. Results are indicated as surviving fraction as compared to control cells treated with media alone. *p < 0.05, **p < 0.01, ***p < 0.001.
Figure 6. Analysis of MIBC patient tumor samples indicates p73 promoter hypermethylation in tumor compared to adjacent normal tissue.
Genomic DNA and total RNA was obtained from patients who underwent neoadjuvant treatment and subsequent cystectomy. (a&b) Average methylation across interrogated CpG sites in P1 and P2 promoter region. (c&d) TAp73 and ∆Np73 mRNA expression level in patients are indicated as ∆Ct. (e) H-scores in tumors and adjacent non-tumors from patients who underwent neoadjuvant therapy. *p < 0.05, **p < 0.01, ***p < 0.001.