Figures & data
Figure 1. Increased body weight and fat mass in Ad-Sirt1-/- mice at the age of 20 weeks.
(a): PCR products amplified from genomic DNA isolated from different tissues of Ad-Sirt1-/- mice as well as adipose tissue from wild-type and control (Sirt1flox/flox) mice. (b): Real-time PCR analysis of Sirt1 expression in adipose tissues. (c): Western blot analysis of SIRT1 expression in the adipose tissue. (d): Body weight. n = 10 mice per group. (e): Subcutaneous and epididymal fat mass. n = 8–10 mice per group. (f): Representative picture of the body, subcutaneous fat and epididymal fat of control and Ad-Sirt1-/- mice at the age of 8 weeks. (g): Representative H&E stain images of epididymal adipose tissue isolated from 8-week-old control and Ad-Sirt1-/- mice. Scale bars, 25 µm. (h): Adipocyte size quantification for epididymal adipose tissue from 8-week-old mice. n = 6–8 mice per group. The data are expressed as the mean ± SEM. *P < 0.05, **P < 0.01.
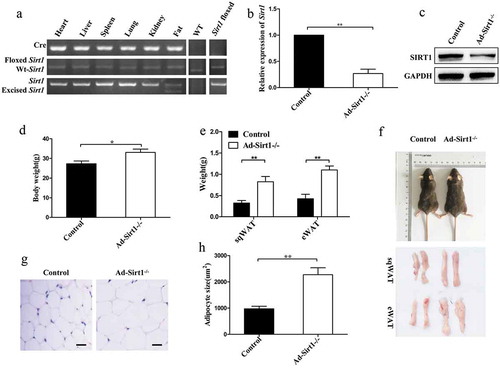
Figure 2. 20-week-old Ad-Sirt1-/- mice develop insulin resistance.
Glucose tolerance tests (a) and insulin tolerance tests (b). n = 8–10 mice per group. Western blot analysis of insulin signaling in adipose tissue (c) and liver (d). Fasting plasma levels of adiponectin (e) and leptin (f). n = 8 mice per group. The data are expressed as the mean ± SEM. *P< 0.05, **P < 0.01, ***P < 0.001.
Figure 3. Ad-Sirt1-/- mice exhibit impaired glucose and lipid metabolism.
(a): Glucose uptake in adipose tissue. n = 6–8 mice per group. (b): Relative mRNA levels of genes associated with β-oxidation in adipose tissues. (c): Fasting plasma levels of glycerol. n = 8 mice per group. (d): Relative mRNA levels of lipolysis-related genes in the adipose tissue. (e): Fasting plasma levels of FFA. n = 8 mice per group. (f): Relative mRNA levels of genes associated with fatty acid and TG synthesis in the liver. (g): Hepatic triglyceride content in mice. n = 7–9 mice per group. (h): Relative mRNA levels of genes associated with gluconeogenesis in the liver. The data are expressed as the mean ± SEM. *P< 0.05, **P < 0.01.
Figure 4. Increased exosomes in Ad-Sirt1-/- mice.
(a): Electron micrographs of exosomes isolated from adipose tissue and plasma. (b): Western blot analysis of exosomes marker proteins expression in adipose, liver and muscle tissues. (c): Semi-quantification of exosomes concentration in plasma of control and Ad-Sirt1-/- mice by Bradford protein assay. n = 8–10 mice per group. (d): Western blot analysis of exosomal proteins in adipocyte lysates and purified exosomes. (e): Western blot analysis of exosomal proteins and adipocyte-specific protein in exosomes isolated from plasma of mice. The data are expressed as the mean ± SEM. *P< 0.05.
Figure 5. GW4869 treatment reverses the impaired metabolism in Ad-Sirt1-/- mice.
(a): Expression of the exosomal protein in adipose tissue and plasma from control and Ad-Sirt1-/- mice in the absence or presence of GW4869 (abbreviated as “GW” in this figure). Bodyweight (b) and fat mass (c). n = 8–10 mice per group. Glucose tolerance tests (d) and insulin tolerance tests (e). n = 8–10 mice per group. F: Western blot analysis of adipose and hepatic insulin sensitivity in Ad-Sirt1-/- mice in the absence or presence of GW4869. n = 7–10 mice per group. The data are expressed as the mean ± SEM. *P< 0.05, **P < 0.01, ***P < 0.001.
Figure 6. The role of Ad-Sirt1-/- adipose tissue-derived exosomes in vitro.
(a): Western blot analysis of insulin signaling in mature 3T3-L1 adipocytes and BNL.CL2 hepatocytes treated with exosomes. (b): Glucose uptake in adipocytes. Relative mRNA levels of genes associated with β-oxidation (c) and lipolysis (d) in adipocytes. Relative mRNA levels of genes associated with fatty acid and TG synthesis (e) and gluconeogenesis (f) in hepatocytes. Here mature 3T3-L1 adipocytes and BNL.CL2 hepatocytes were treated with exosomes isolated from adipose tissue of four different groups of mice (a: Control mice treated with vehicle; b: Ad-Sirt1-/- mice treated with vehicle; c: Control mice treated with GW4869; d: Ad-Sirt1-/- mice treated with GW4869. And GW4869 is abbreviated as “GW” in this figure). The data are expressed as the mean ± SEM. *P< 0.05, **P< 0.01.
Figure 7. Adipose Sirt1 deficiency induces exosomes in an autophagy-dependent manner.
(a): Western blot analysis of autophagy marker proteins in adipose tissue. (b): Relative mRNA expression of autophagy-related genes. (c): Determination of autophagic flux by chloroquine. (d): Expression of exosomal proteins in mature 3T3-L1 adipocytes after administration of Atg7 siRNA (100 nM). (e): Expression of exosomal proteins in primary adipocytes treated with rapamycin (10 nM). The data are expressed as the mean ± SEM from three independent experiments. *P < 0.05, **P < 0.01.
Figure 8. Restoration of SIRT1 activity by SRT1720 improves the impaired metabolic profiles in vitro.
(a): Western blot analysis of exosomal protein in primary control and Ad-Sirt1-/- adipocytes in the absence or presence of 5 μM SRT1720. Relative mRNA levels of genes associated with β-oxidation (b) and lipolysis (c). (d): Western blot analysis of insulin signaling and autophagy activity. The data are expressed as the mean ± SEM from three independent experiments.*P< 0.05, **P < 0.01.
Figure 9. Adipose Sirt1 deficiency modulates insulin sensitivity by exosomes via TLR4/NF-κB signaling pathway.
(a): TLR4 signaling in adipose tissues. (b): Insulin signaling in mature 3T3-L1 adipocytes after the treatment of Ad-Sirt1-/- adipose tissue-derived exosomes and Tlr4 siRNA. The activation of NF-κB in adipose tissue (c) and 3T3-L1 adipocytes (d). (e): Effect of Ikkβ siRNA (100 nM) on exosomes-dependent NF-κB activation. (f): Western blot analysis of insulin signaling in the 3T3-L1 adipocytes exposure to Ad-Sirt1-/–derived exosomes and SN50. The data are expressed as the mean ± SEM from three independent experiments. *P < 0.05, **P< 0.01.