
Figures & data
Figure 1. Box plot represents the expression of (a) HIF-1α, (b) HIF-2α, and (c) SNAIL1 protein in the kidney cortex compared with ccRCC tumors (Mann-Whitney U-test, significant at P< 0.05). Kaplan-Meier plots represents the cancer-specific survival curves of (d) HIF-1α, (E) HIF-2α, and (F) SNAIL1 protein levels in ccRCC (Kaplan-Meier survival analysis, significant at P < 0.05).
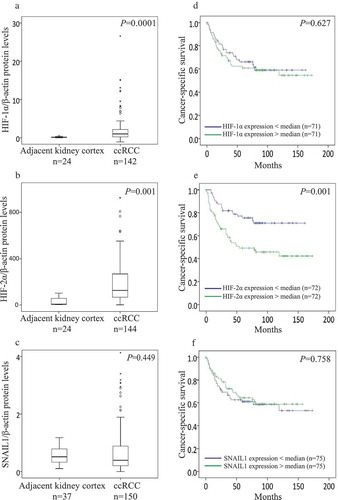
Table 1. Relation of HIF-1α, HIF-2α, and SNAIL1 protein levels with categorized clinicopathological parameters in ccRCC.
Figure 2. (a) Immunoblots show protein expression of ALK5-full length (ALK5-FL), pSMAD2/3, SMAD2/3, PAI-1, SNAIL1, HIF-1α, HIF-2α, GLUT-1, CA9, and VHL after transfection of indicated vectors in ACHN cells followed by TGF-β stimulation for 6h (n = 3 independent experiments). All protein bands in each lane originated from the same cell lysate. β-actin served as internal loading control; (b) Immunoblots showing protein expression of ALK5-full length (ALK5-FL), pSMAD2/3, SMAD2/3, PAI-1, SNAIL1, HIF-1α, HIF-2α, GLUT-1, CA9, and VHL after transfection of indicated vectors in A498 cells followed by TGF-β treatment for 6h (n = 3 independent experiments). All protein bands in each lane originated from the same cell lysate. β-actin served as an internal loading control. (c) Immunoblots show protein expression of ALK5-full length (ALK5-FL), pSMAD2/3, SMAD2/3, PAI-1, SNAIL1, HIF-1α, HIF-2α, GLUT-1, CA9 and VHL after transfection of indicated vectors in ACHN cells followed by ALK5 specific Kinase Inhibitor (RepSox) treatment, 100 µM for 6h prior to TGF-β stimulation for 6h (n = 3 independent experiments). All protein bands in each lane originated from the same cell lysate. β-actin served as an internal loading control. (d) Immunoblots show protein expression of ALK5-full length (ALK5-FL), pSMAD2/3, SMAD2/3, PAI-1, SNAIL1, HIF-1α, HIF-2α, GLUT-1, CA9 and VHL after transfection of indicated vectors in A498 cells followed by ALK5 specific Kinase Inhibitor (RepSox) treatment, 100 µM for 6h prior to TGF-β stimulation for 6h (n = 3 independent experiments). All protein bands in each lane originated from the same cell lysate. β-actin served as an internal loading control.
Table 2. Correlations of HIF-1α and HIF-2α proteins, with ALK5-FL, ALK5-ICD, pSmad2/3, PAI-1 and SNAIL1.
Figure 3. (a) Immunoblots show protein expression of HIF-1α, HIF-2α, GLUT-1, CA9, ALK5-full length (ALK5-FL), pSMAD2/3, SMAD2/3, and VHL after treatment with CoCl2 (300 µM) at indicated time points in ACHN cells (n = 3 independent experiments). All protein bands in each lane originated from the same cell lysate. β-actin served as an internal loading control. (b) Immunoblots show protein expression of HIF-1α, HIF-2α, GLUT-1, CA9, ALK5-full length (ALK5-FL), pSMAD2/3, and SMAD2/3, and VHL after treatment with CoCl2 (300 µM) at indicated time points in A498 cells (n = 3 independent experiments). All protein bands in each lane originated from the same cell lysate. β-actin served as an internal loading control.
Figure 4. Immunoprecipitation and Proximity Ligation Assay shows interaction of ALK5 with HIF-1α and HIF-2α. (a) Immunoblots show IP with HA or HIF-1α or HIF-2α or ALK5 antibody: ACHN cells were transfected with ALK5-HA or co-transfected with ALK5-HA and siVHL vectors, followed by TGF-β treatment for 6h, and probed with HA or HIF-1α, or HIF-2α or ALK5 antibody, respectively. (b) Proximity Ligation Assay (PLA): ACHN cells were transiently co-transfected with indicated vectors, followed by TGF-β treatment for 6h. After fixation and blocking, PLA was performed using HA and HIF-1α or HIF-2α antibodies. HIF-1α-ALK5-HA complexes or HIF-2α-ALK5-HA complexes were visualized as red signals. Scale bar 50 μm (PLA performed without adding one of the primary antibodies served as the control, student’s T-test, significant at *P < 0.05, **P < 0.005, mean ± SD of three experiments, 500 cells were analyzed in each group). (c) Immunoblots show IP with HA or HIF-1α or HIF-2α or ALK5 antibody. A498 cells were transfected with ALK5-HA, or co-transfected with ALK5-HA and VHL vectors, followed by TGF-β treatment for 6h, and probed with HA or HIF-1α, or HIF-2α or ALK5 antibody, respectively. (d) Proximity Ligation Assay (PLA): A498 cells were transiently co-transfected with indicated vectors, followed by TGF-β treatment for 6h. After fixation and blocking, PLA was performed using HA and HIF-1α or HIF-2α antibodies. HIF-1α-ALK5-HA complexes or HIF-2α-ALK5-HA complexes were visualized as red signals. Scale bar 50 μm (PLA performed without adding one of the primary antibodies served as the control, student’s T-test, significant at *P < 0.05, **P < 0.005, mean ± SD of three experiments, 500 cells were analyzed in each group).
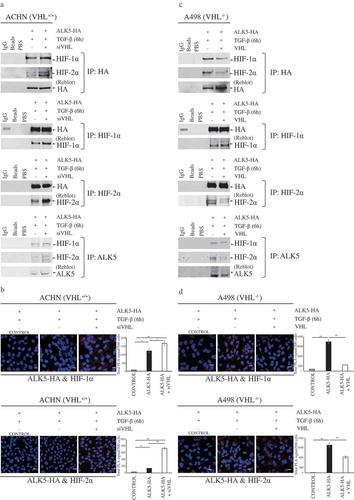
Figure 5. Schematic illustration of synergistic crosstalk between hypoxia and TGF-β signaling pathway. VHL inhibits expression of ALK5 protein by targeting it for proteasomal degradation [Citation13], and expression of HIF-1α/2α under normoxic conditions. Hypoxic conditions increase the expression of HIF-1α/HIF-2α and ALK5. ALK5, through its kinase activity, increases the expression of HIF-1α/HIF-2α under normoxic conditions. Physical interaction between ALK5 and HIF-1α/HIF-2α produces a synergistic effect to promote tumor progression and leads to poor prognosis for patients with ccRCC.
![Figure 5. Schematic illustration of synergistic crosstalk between hypoxia and TGF-β signaling pathway. VHL inhibits expression of ALK5 protein by targeting it for proteasomal degradation [Citation13], and expression of HIF-1α/2α under normoxic conditions. Hypoxic conditions increase the expression of HIF-1α/HIF-2α and ALK5. ALK5, through its kinase activity, increases the expression of HIF-1α/HIF-2α under normoxic conditions. Physical interaction between ALK5 and HIF-1α/HIF-2α produces a synergistic effect to promote tumor progression and leads to poor prognosis for patients with ccRCC.](/cms/asset/aea75a2b-7b36-4ea0-a488-1a35c7c6577c/kccy_a_1642069_f0005_oc.jpg)