Figures & data
Figure 1. MLN4924 effectively induces cell death in Ph+ leukemia cells. In vitro MLN4924-sensitivity of B-ALL cell lines (a) and MM cell lines (b). Cells were treated for 3 days with the indicated concentrations of MLN4924, cell death was determined by 7-AAD staining and flow-cytometry, and specific cell death was calculated as indicated in the materials and methods section. Three independent experiments were performed and cultures were done in quadruplicate, means ± SEM are shown. EC50 values were calculated by non-linear regression.
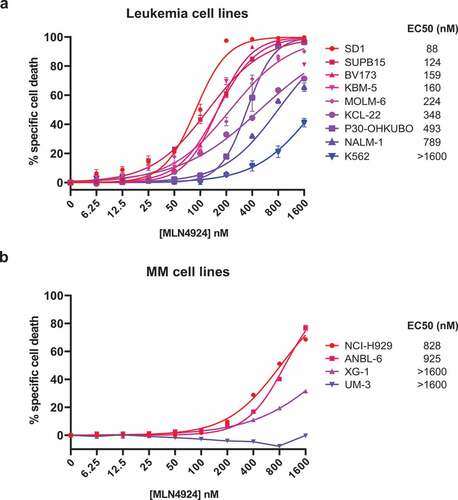
Figure 2. MLN4924 synergizes with imatinib and HU for the induction of cell death in Ph+ leukemia cells. (a) Ph+ leukemia cell lines were treated for 3 days with various concentrations of MLN4924 and imatinib at a fixed ratio of 1:100. Three independent experiments were performed, cultures were done in quadruplicate, means ± SEM are shown. (b) SUP15 and BV173 cells were treated for 3 days with indicated concentrations of MLN4924 and ponatinib at a fixed ratio of 5:1. Three independent experiments were performed, cultures were done in triplicate, means ± SEM of a representative experiment are shown. (c) Ph+ leukemia cell lines were treated overnight with various concentrations of MLN4924 and HU at a fixed ratio of 1:1000, as indicated. Three independent experiments were performed, cultures were performed in quadruplicate, means ± SEM are shown. Combination index (CI) values are given for each relevant data point.
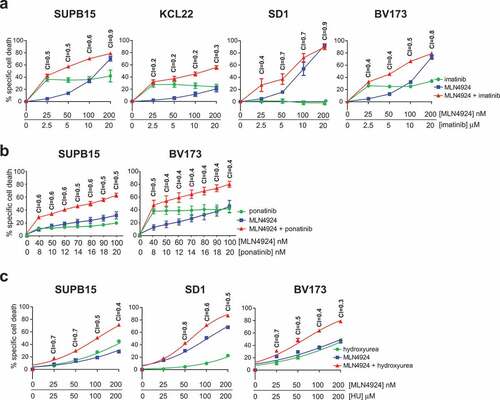
Figure 3. ABL T315I-mutant imatinib resistant Ph+ leukemia cells are sensitive for MLN4924. (a) MLN4924 and imatinib synergize to induce cell death in the Ph+ leukemia cell line KBM5, but not in the imatinib-resistant KBM5 ABL T315I-mutant subline. (b) MLN4924 and ponatinib synergize to induce cell death in both the KBM5 and the KBM5 ABL T315I-mutant subline. Cells were treated for for 3 days with various concentrations of MLN4924 and ponatinib at a fixed ratio of 5:1. Percent specific cell death is shown. Means ± SEM of representative of three independent experiments of triplicate cultures are shown. Combination index (CI) values are given for each relevant data point.
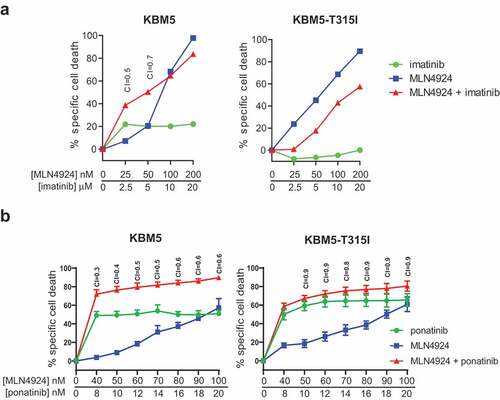
Figure 4. MLN4924 stabilizes β-catenin and p27, activates the cell-cycle checkpoint protein CHK1 and induces DNA damage in Ph+ leukemia cells. (a) Immunoblot analysis for β-catenin, p27 and phospho-CHK1 (ser317) levels in BV173 and SUPB15 Ph+ leukemia cells treated for 24 hours with MLN4924 at indicated concentrations. The β-catenin blot was used to control for loading. (b) Immunofluorescent γH2AX staining in BV173 cells treated overnight with DMSO (vehicle) or 400 nM MLN4924, with our without Q-VD-OPh. (c) Bar graphs showing percent of cells with >10 γH2AX foci in BV173 and SUPB15 treated as indicated. For each condition, at least 6 non-overlapping images were captured with a 40x magnification objective and scored manually (on average approximately 120 cells per condition). Means ± SEM are shown. Asterisks indicate statistically significant differences (*p < 0.05; ** p < 0.01, *** p < 0.001, One-way ANOVA).
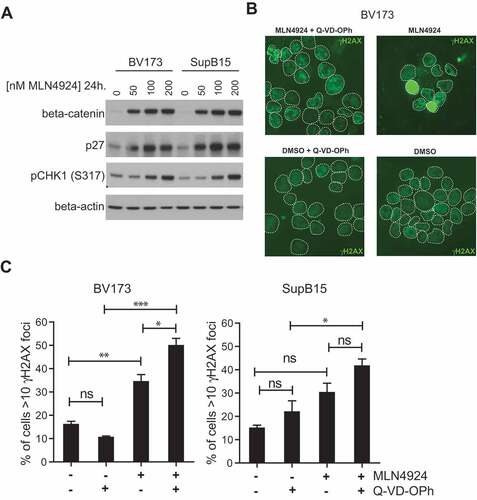
Figure 5. Activation of the intra S-phase cell-cycle checkpoint is responsible for the induction of cell death in MLN4924-treated Ph+ leukemia cells. (a) BrdU-incorporation and cell-cycle analysis of BV173 cells treated overnight with 400 nM MLN4924, 0.5 μM imatinib, or the combination of both (upper panels), and in combination with Q-VD-OPh treatment (lower panels). Percent of cells within the gates are indicated. (b) Bargraph depicting the percent of BV173 cells in the different cell-cycle stages, treated as indicated (left panel), and the percent of cells in early-, mid-, and late-S-phase (determined within S-phase gate), treated as indicated (right panel). Means ± SEM of three independent experiments are shown (c) MLN4924 induces DNA damage in late G1-/early S-phase cells. BV173 cells were overnight exposed to various concentrations of MLN4924 and imatinib as indicated. Intranuclear γH2AX was assessed and plotted against DNA content. Percent γH2AX+ cells are indicated. Bargraph depicts the means ± SEM of percentages of γH2AX+ cells of three independent experiments. Asterisks indicate statistically significant differences (** p < 0.01, *** p < 0.001, One-way ANOVA).
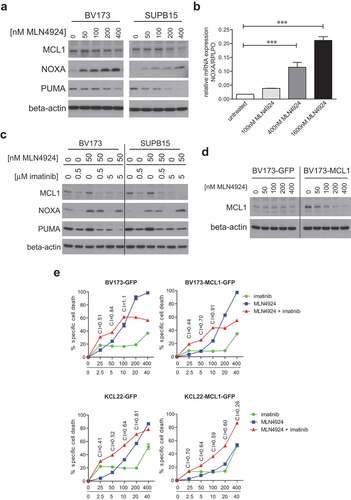
Figure 6. MLN4924 and imatinib treatment alters the MLC1/NOXA balance in Ph+ leukemia cells. (a) Immunoblotting analysis of MCL1, NOXA, and PUMA protein expression in BV173 and SUPB15 cells overnight exposed to various concentrations of MLN4924. Beta-actin blotting was used to control for loading. (b) Quantitative RT-PCR analysis of NOXA expression in BV173 cells overnight exposed to various concentrations of MLN4924. The ratio of NOXA/RPLPO (housekeeping gene) expression is depicted. Means ± SEM of three independent experiments are shown, PCRs were performed in triplicate (*** p < 0.001, One-way ANOVA, Dunn’s post-test). (c) Immunoblot analysis of MCL1, NOXA and PUMA protein levels in BV173 and SUPB15 cells treated overnight with MLN4924 and imatinib, at the indicated concentrations. β-catenin- blotting was used to control for loading. (d) Immunoblot analysis of MCL1 protein expression in BV173 cells transduced with empty vector (BV173-GFP) or with retroviral MCL1 overexpression construct (BV173-MCL1). Cells were treated overnight with various concentrations of MLN4924 as indicated. Beta-actin blotting was used to control for loading. (e) MCL1 overexpression diminishes the sensitivity for MLN4924 and imatinib but does not abrogate synergy. BV173-MCL1 and BV173-GFP cells (upper panels) and KCL22-MCL1 and KCL22-GFP (lower panels) were treated for 3 days with various concentrations of MLN4924 and imatinib at a fixed ratio of 1:100, CI values for relevant data point are indicated. Means ± SEM of percent specific cell death are depicted in the graphs.