
Figures & data
Table 1. PCR primer sequences.
Figure 1. High expression of UCA1 and ZEB2 and low expression of miR-498 in EC tissues. A. Expression levels of UCA1, miR-498 and ZEB2 mRNA in EC tissues and adjacent normal tissues; B. Correlation analysis of UCA1 and miR-498 expression in EC tissues; C. ZEB2 immunohistochemical staining for positive rate of ZEB2 protein in EC tissues and adjacent normal tissues (× 400, 25 μm); D. Comparison of positive rate of ZEB2 protein expression in EC tissues and adjacent normal tissues; E. Protein band of ZEB2 protein in EC tissues and adjacent normal tissues; F. Quantification results of ZEB2 protein expression in EC tissues and adjacent normal tissues; * P < 0.05 vs adjacent normal tissues. Data were expressed in the form of mean ± standard deviation. The t-test was used for data analysis.
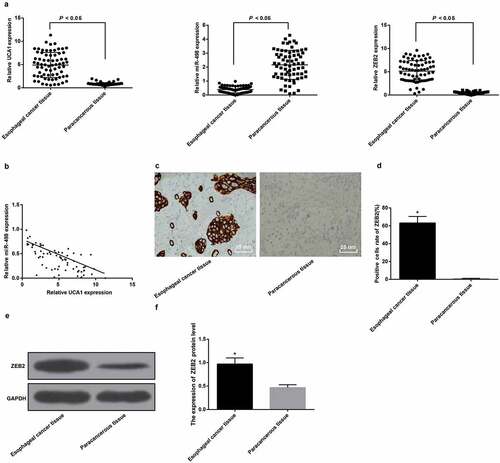
Table 2. Distinct correlation between TNM staging and lymph node metastasis of esophageal cancer and UCA1 expression.
Figure 2. Silencing lncRNA UCA1 up-regulates miR-498 expression, thereby down-regulating ZEB2 expression. A. UCA1 subcellular localization predicted by online analysis website; B. UCA1 subcellular localization verified by FISH assay (× 800, 12.5 μm); C. The binding site of UCA1 and miR-498 predicted in RNA22 website; D. The combination of UCA1 and miR-498 verified by luciferase activity assay; E. RNA pull-down detection of UCA1 enrichment by miR-498; F. The target relationship between miR-498 and ZEB2 predicted by Targetscan website; G. The targeting relationship between miR-498 and ZEB2 verified by luciferase activity assay. * means P < 0.05; The data in the figure were all measurement data, expressed as mean ± standard deviation. The independent sample t-test was used for statistical analysis between the two groups, One-way ANOVA was used for the comparison among multiple groups, and LSD-t was used for pairwise comparison after ANOVA analysis. The experiment was repeated three times.
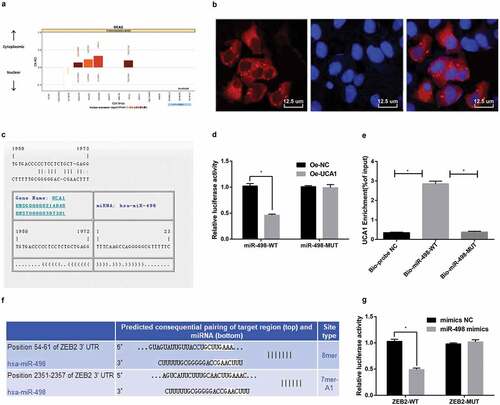
Figure 3. High expression of UCA1 and ZEB2 and low expression of miR-498 in EC cell lines. A. UCA1, miR-498 and ZEB2 mRNA expression in Het-1A, TE-1, TE-7, KYSE510, KYSE150 and EC9706 cell lines; B. Protein bands of ZEB2 in Het-1A, TE-1, TE-7, KYSE510, KYSE150, EC9706 cell lines; C. Quantification results of protein expression of ZEB2 in Het-1A, TE-1, TE-7, KYSE510, KYSE150, EC9706 cell lines; * P < 0.05 vs Het-1A cell line; N = 3, the data were expressed in the form of mean ± standard deviation; One-way ANOVA was used for data analysis, and LSD-t was used for pairwise comparison after ANOVA analysis.
Figure 4. Up-regulated miR-498 and declined ZEB2 by down-regulated UCA1. A. Expression of UCA1, miR-498 and ZEB2 mRNA in transfected cells of each group; B. Protein bands of ZEB2 in transfected cells of each group; C. Quantification results of protein expression of ZEB2 in transfected cells of each group; * P< 0.05 vs the siRNA-NC group. # P < 0.05 vs the mimics-NC group; & P < 0.05 vs the pcDNA-UCA1 + mimics-NC group. N = 3, the data were expressed in the form of mean ± standard deviation; One-way ANOVA was used for data analysis, and LSD-t was used for pairwise comparison after ANOVA analysis.
Figure 5. Inhibited cell colony formation ability of EC9706 cells by silencing UCA1 and up-regulated miR-498. A. Colony formation after transfection of EC9706 cells in each group; B. Comparison of the number of colonies after transfection of EC9706 cells in each group; * P < 0.05 vs the siRNA-NC group. # P< 0.05 vs mimics-NC group; & P < 0.05 vs the pcDNA-UCA1 + mimics-NC group. N = 3, the data were expressed in the form of mean ± standard deviation; One-way ANOVA was used for data analysis, and LSD-t was used for pairwise comparison after ANOVA analysis.
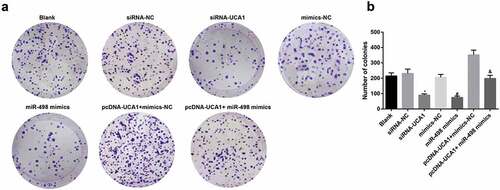
Figure 6. Inhibited cell proliferation of EC9706 cells by silencing UCA1 and up-regulated miR-498. A. Differences in cell proliferation after transfection of EC9706 cells in each group; B. Protein bands of PCNA and c-Myc in transfected EC cells of each group; C. Quantification results of PCNA protein expression after transfection of EC9706 cells in each group; D. C-Myc protein expression after transfection of EC9706 cells in each group; * P < 0.05 vs the siRNA-NC group. # P < 0.05 vs mimics-NC group; & P < 0.05 vs the pcDNA-UCA1 + mimics-NC group. N = 3, the data were expressed in the form of mean ± standard deviation; One-way ANOVA was used for data analysis, and LSD-t was used for pairwise comparison after ANOVA analysis.
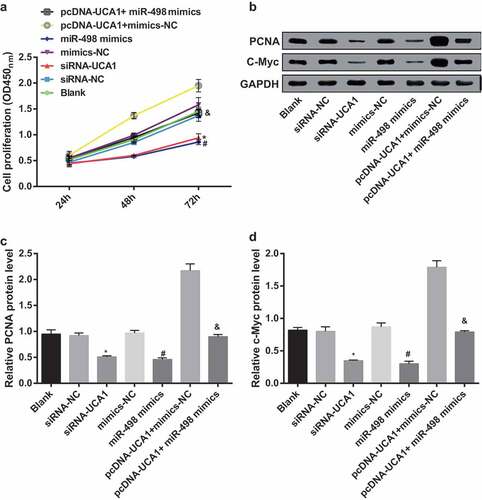
Figure 7. Declining cell migration and invasion of EC9706 cells by silencing UCA1 and up-regulated miR-498. A. Comparison of migration and invasion ability of EC9706 cells in each group after transfection (× 100, 100 μm); B. Comparison of migration and invasion numbers of EC9706 cells in each group after transfection; C. Protein bands of MMP-2 and MMP-9 in transfected EC9706 cells of each group; D. Quantification results of protein expressions of MMP-2 and MMP-9 in transfected EC9706 cells of each group;* P < 0.05 vs the siRNA-NC group. # P< 0.05 vs mimics-NC group; & P < 0.05 vs the pcDNA-UCA1 + mimics-NC group. N = 3, the data were expressed in the form of mean ± standard deviation; One-way ANOVA was used for data analysis, and LSD-t was used for pairwise comparison after ANOVA analysis.
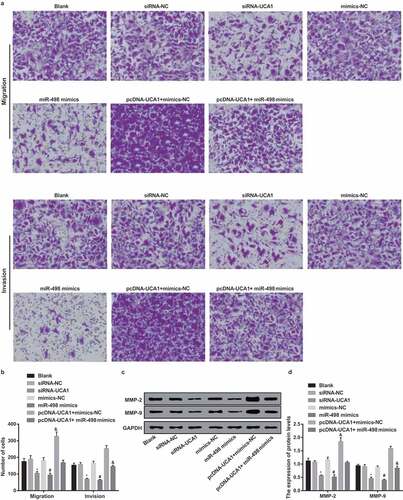
Figure 8. Inhibited EMT of EC9706 cells by silencing UCA1 and up-regulated miR-498. A. Protein bands of E-cadherin and N-cadherin in transfected EC9706 cells of each group; B. Quantification results of protein expression of E-cadherin and N-cadherin in transfected EC9706 cells of each group; * P < 0.05 vs the siRNA-NC group. # P < 0.05 vs mimics-NC group; & P < 0.05 vs the pcDNA-UCA1 + mimics-NC group. N = 3, the data were expressed in the form of mean ± standard deviation; One-way ANOVA was used for data analysis, and LSD-t was used for pairwise comparison after ANOVA analysis.
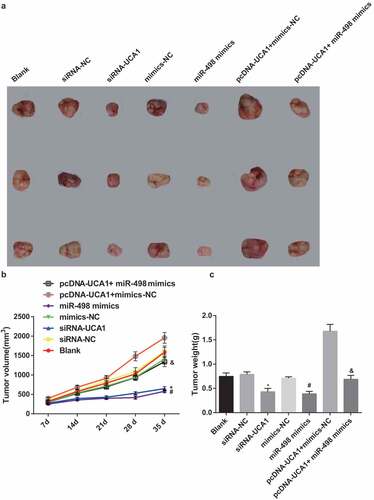
Figure 9. Declining tumor volume and tumor weight in nude mice with EC by silencing UCA1 and up-regulated miR-498. A. Tumorigenesis of nude mice transfected with EC9706 cells in each group; B. Changes in tumor volume of nude mice after transfection of EC9706 cells in each group; C. Comparison of tumor weight of glioma after transfection of EC9706 cells in each group; * P < 0.05 vs the siRNA-NC group. # P < 0.05 vs mimics-NC group; & P < 0.05 vs the pcDNA-UCA1 + mimics-Nc group. N = 3, the data were expressed in the form of mean ± standard deviation; One-way ANOVA was used for data analysis, and LSD-t was used for pairwise comparison after ANOVA analysis.
Data availability statement
Research Data are not shared.