Figures & data
Figure 1. The MALAT1 mRNA expression in HS-5, U266, MM.1S and RPMI8226 cells analyzed by RT-qPCR. ***P < 0.001 vs. HS-5 cells
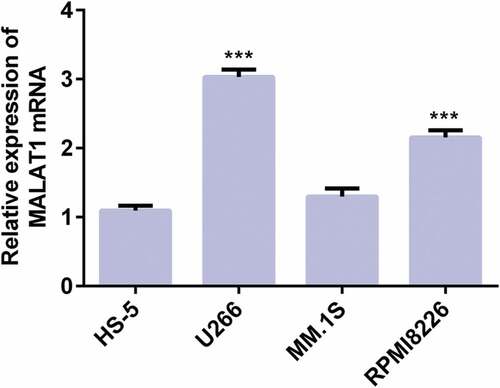
Figure 2. LncRNA MALAT1 interference inhibits proliferation and promotes apoptosis of myeloma cells. (A) The transfection effect was assessed by RT-qPCR. ***P < 0.001 vs. control group. ###P < 0.001 vs. sh-NC group. (B) The transfection effect was assessed by western blot. *P < 0.05 and ***P < 0.001 vs. control group. #P < 0.05 and ###P < 0.001 vs. sh-NC group. (C) The effect of LncRNA MALAT1 interference on cell proliferation was determined by CCK-8 assay. **P < 0.01 and ***P < 0.001 vs. control group. #P < 0.05 vs. sh-NC group. (D) The proliferation related proteins (CDK2, cyclinE1, and P21) were detected by Western blot. **P < 0.01 and ***P < 0.001 vs. control group. ##P < 0.01 and ###P < 0.001 vs. sh-NC group. (E/F) The cell apoptosis rate was determined by flow cytometry analysis. ***P < 0.001 vs. control group. ###P < 0.001 vs. sh-NC group. (G) The apoptosis related proteins (Bcl-2, Bax, and cleaved caspase3) were detected by Western blot. **P < 0.01 and ***P < 0.001 vs. control group. ##P < 0.01 and ###P < 0.001 vs. sh-NC group
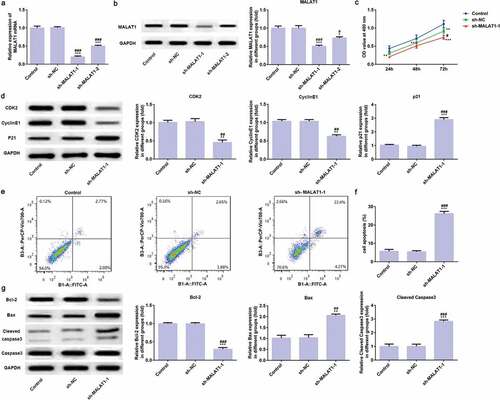
Figure 3. LncRNA MALAT1 interference inhibits adhesion of myeloma cells. The ELISA was used to detect the expression levels of IL-1 (a), TNFα (b), IFNγ (c), and Muc-1 (d), ICAM-1 (e), and VCAM-1 (f). ***P < 0.001 vs. control group. ##P < 0.01 and ###P < 0.001 vs. sh-NC group
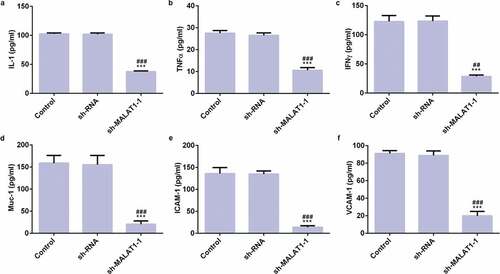
Figure 4. LncRNA MALAT1 interference inhibits proliferation and adhesion of myeloma cells through Hippo-YAP signaling pathway. The proteins (MST1, LATS1, P-YAP1, and YAP1) related to Hippo-YAP signaling pathway were detected by western blot. **P < 0.01 and ***P < 0.001 vs. control group. ##P < 0.01 and ###P < 0.001 vs. sh-NC group
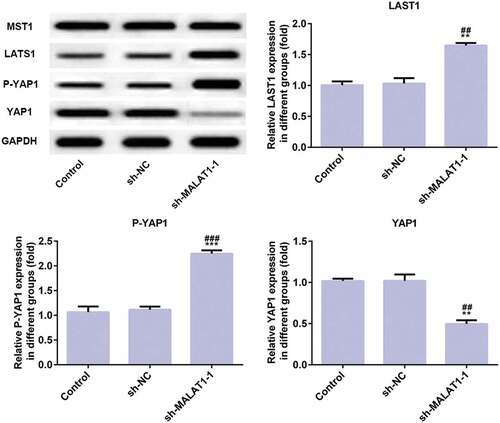
Figure 5. LncRNA MALAT1 directly targets miR-181a-5p. (a) Interaction between miR-181a-5p and 3ʹUTR of MALAT1 was predicted by starBase. (b) Luciferase activity of a reporter containing MALAT1 3ʹUTR-WT or 3ʹUTR-MUT (with a mutation in the miR-181a-5p binding site). ***P < 0.001 vs. control group. (c) The miR-181a-5p expression was upregulated in myeloma cells transfected with sh-MALAT1. ***P < 0.001 vs. control group. ###P < 0.001 vs. sh-NC group. (d) The miR-181a-5p expression in myeloma cells was detected by RT-qPCR. **P < 0.01 and ***P < 0.001 vs. HS-5 group
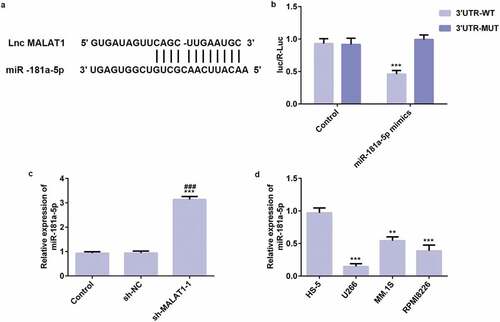
Figure 6. MiR-181a-5p overexpression inhibits proliferation and promotes apoptosis of myeloma cells. (a) The transfection effect was assessed by RT-qPCR. ***P < 0.001 vs. control group. ###P < 0.001 vs. sh-NC group. (b) The effect of miR-181a-5p overexpression on cell proliferation was determined by CCK-8 assay. *P < 0.05 and **P < 0.01 and ***P < 0.001 vs. control group. #P < 0.05 vs. sh-NC group. ∆P < 0.05 vs. miR-181a-5p mimics group. (c/d) The proliferation related proteins (CDK2, cyclinE1, and P21) were detected by Western blot. ***P < 0.001 vs. control group. ###P < 0.001 vs. sh-NC group. ∆P < 0.05 vs. miR-181a-5p mimics group. ∆∆P < 0.01 and ∆∆∆P < 0.001 vs. miR-181a-5p mimics group. (e/f) The cell apoptosis rate was determined by flow cytometry analysis. ***P < 0.001 vs. control group. ###P < 0.001 vs. sh-NC group. ∆∆∆P < 0.001 vs. miR-181a-5p mimics group. (g/h) The apoptosis related proteins (Bcl-2, Bax, and cleaved caspase3) were detected by Western blot. ***P < 0.001 vs. control group. ###P < 0.001 vs. sh-NC group. ∆∆P < 0.01 and ∆∆∆P < 0.001 vs. miR-181a-5p mimics group
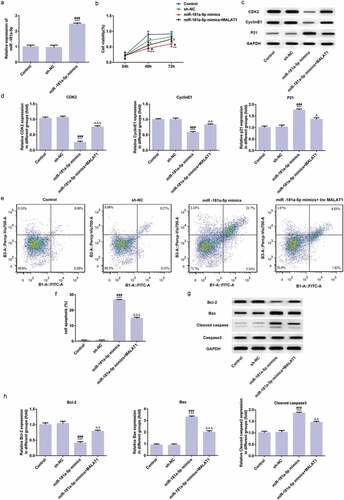
Figure 7. MiR-181a-5p overexpression inhibits adhesion of myeloma cells. The ELISA was used to detect the expression levels of IL-1 (a), TNFα (b), IFNγ (c), and Muc-1 (d), ICAM-1 (e), and VCAM-1 (f). ***P < 0.001 vs. control group. ##P < 0.01 and ###P < 0.001 vs. sh-NC group. ∆P < 0.05, ∆∆P < 0.01, and ∆∆∆P < 0.001 vs. miR-181a-5p mimics group
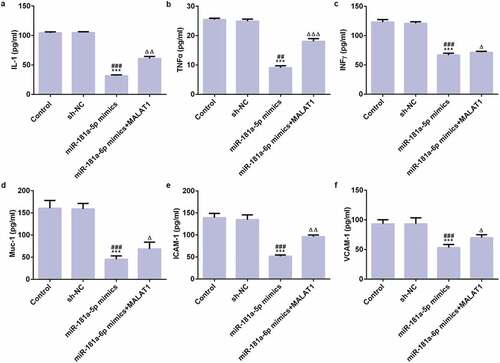
Figure 8. MiR-181a-5p overexpression inhibits proliferation and adhesion of myeloma cells through Hippo-YAP signaling pathway. The proteins (MST1, LATS1, P-YAP1, and YAP1) related to Hippo-YAP signaling pathway were detected by western blot. ***P < 0.001 vs. control group. ###P < 0.001 vs. sh-NC group. ∆P < 0.05 and ∆∆P < 0.01 vs. miR-181a-5p mimics group
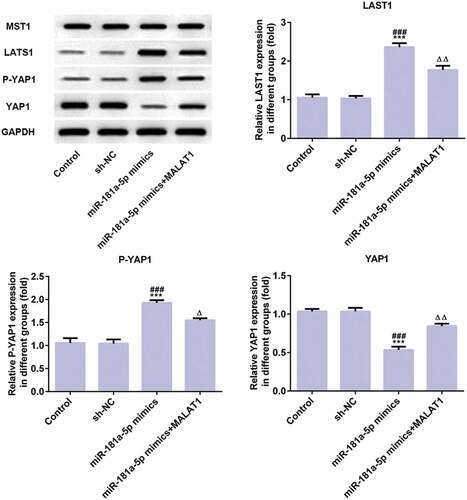
Figure 9. LncRNA MALAT1 interference inhibits tumor growth. (a) The phenotypes of tumors in vitro. (b) The phenotypes of tumors in vivo. (c) The tumor growth curve according to tumor volume. *P < 0.05 vs. control group. (d) The tumor growth curve according to tumor weight. ***P < 0.001 vs. control group. ###P < 0.001 vs. sh-NC group
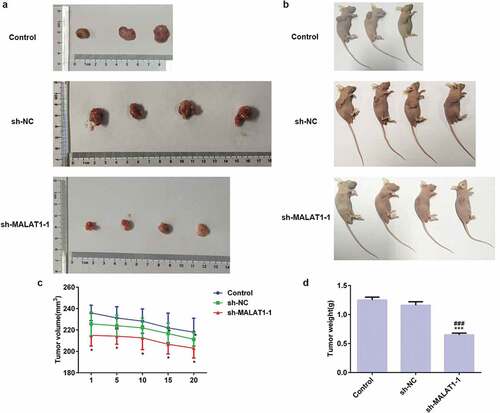
Figure 10. LncRNA MALAT1 interference inhibits the expression of proliferation and adhesion related proteins. (a) The expression of miR-181a-5p in tumor after transfection. ***P < 0.001 vs. control group. ###P < 0.001 vs. sh-NC group. (b) The expression of proliferation (Ki-67) and adhesion (Muc-1, ICAM-1, and VCAM-1) related proteins was detected by immunohistochemistry
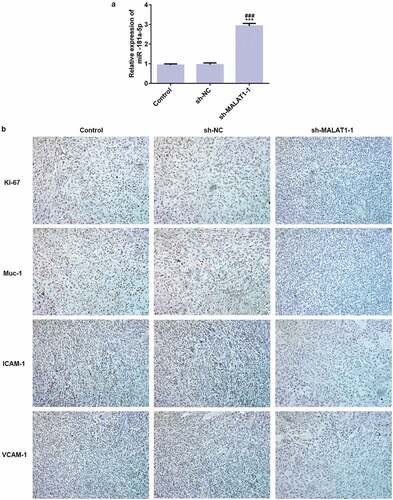
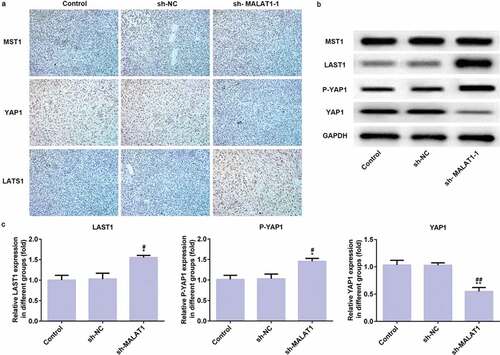
Figure 11. LncRNA MALAT1 interference inhibits tumor growth through Hippo-YAP signaling pathway. (a) The proteins (MST1, LATS1, and YAP1) related to Hippo-YAP signaling pathway were detected by immunohistochemistry. (b/c) The proteins (MST1, LATS1, P-YAP1, and YAP1) related to Hippo-YAP signaling pathway were detected by western blot. *P < 0.05 and **P < 0.01 vs. control group. #P < 0.05 and ##P < 0.01 vs. sh-NC group