Figures & data
Figure 1. Expression and subcellular localization of CENPF during early embryo development. a. CENPF expression was detected by western blot. TUBB was used as a loading control. Experiments were performed as triplicates. b. and c. Early embryos at different stages were stained with antibody to detect CENPF. DNA was stained with Hoechst 33342. The slides were examined under a confocal microscope. Scale bar, 20 μm.
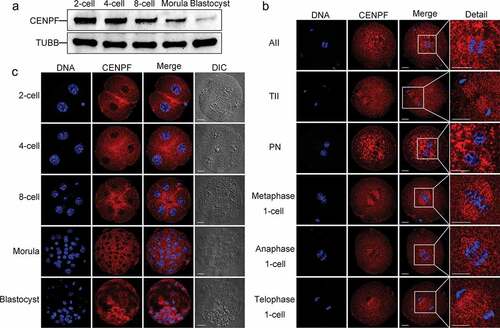
Figure 2. CENPF localization during early embryo development was farnesylation dependent. a. Illustration of FTI SCH66336 treatment on zygotes. Zygotes were collected and cultured in medium with different concentrations of FTI. Samples were collected at 12 h, 24 h, 36 h, 48 h, 72 h, and 96 h for immunoblotting and immunofluorescence analyses. CENPF expression after FTI treatment for b. 12 h, c. 24 h, d. 36 h, e. 48 h, f. 72 h, and g. 96 h; TUBB was used as a loading control. Localization of CENPF during different early embryo stages after FTI treatment for h. 12 h, i. 24 h, j. 36 h, k. 48 h, l. 72 h, and m. 96 h. DNA was stained with Hoechst 33342. White arrows indicate CENPF localization to nuclear membranes. White frame indicates the region shown in detail. Scale bar, 20 μm.
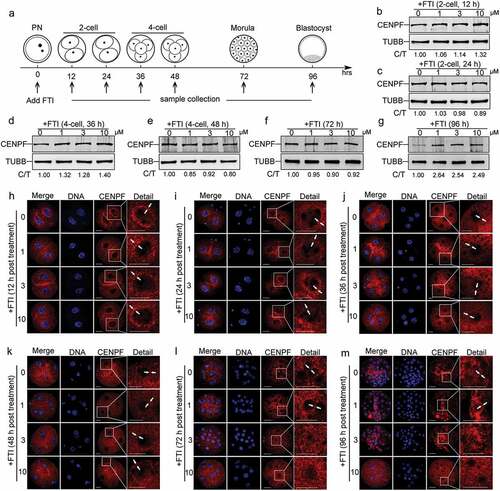
Figure 3. CENPF-C630 localization during early embryo development was farnesylation dependent. a. Schematic of C630 and C630 mutants. b. Immunoblot showing the relative expression levels of C630 and the CAAX mutants with or without FTI treatment. Samples were collected at 96 h after 10 μM SCH66336 treatment. C630 expression was detected using anti-cMyc antibody. TUBB was used as a loading control. Experiments were performed as triplicates. Localization of C630 and the CAAX mutants at c. 4-cell (48 h), d. morula (72 h), and e. blastocyst (96 h) with or without FTI treatment. Embryos were stained with anti-cMyc antibody. DNA was stained with Hoechst 33342. Scale bar, 20 μm.
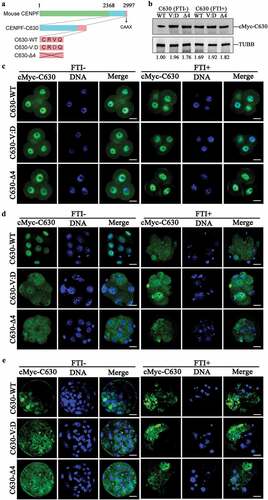
Figure 4. Depletion of CENPF in MII oocytes by CENPF-MO-1 injection caused early embryo development failure. a. Western blot of CENPF expression after control or CENPF-MO injection. TUBB was used as a loading control. One representative experiment is shown. b. Localization of CENPF at 4-cell after Ctrl-MO-1 or CENPF-MO-1 injected into MII stage oocytes. Embryos were stained with anti-CENPF antibody. DNA was stained with Hoechst 33342. Scale bar, 20 μm. c. Percentages for embryonic developmental stages of cultured MO-injected MII oocytes. d. Morphology of embryos. White-dashed lines indicate embryos. DNA was stained with Hoechst 33342. Scale bar, 30 μm. e. Cell numbers per embryo 78 h after MO injection of MII oocytes. f. Image of blastocysts 102 h after MO injection. Black arrows indicate the embryos shown in detail in the lower corners. Scale bar, 50 μm. Quantified data are shown as mean ± S.D. **P < 0.01; ***P < 0.001.
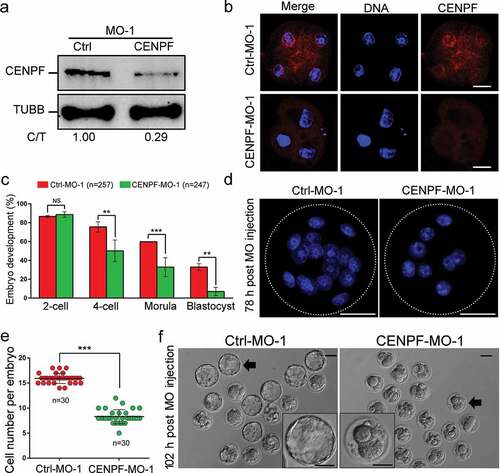
Figure 5. Depletion of CENPF in zygotes by CENPF-MO-1 injection caused early embryo development failure. a. CENPF expression analysis after MO injection. Zygotes injected with Ctrl-MO or CENPF-MO were cultured to the 4-cell stage for western blot analysis. TUBB was used as a loading control. The results of one representative experiment of three independent replicates are presented. b. CENPF-MO injection caused early embryo development failure. c. Morphology of embryos. White-dashed lines indicate embryos. DNA was stained with Hoechst 33342. Scale bar, 30 μm. d. Cell numbers per embryo 72 h after MO injection of zygotes. e. CENPF-MO injection caused blastocyst formation failure. Images were acquired 96 h after MO injection. Black arrows indicate the embryos shown in detail in the lower corners. Scale bar, 50 μm. Quantified data are shown as mean ± S.D. * P < 0.05; ***P < 0.001.
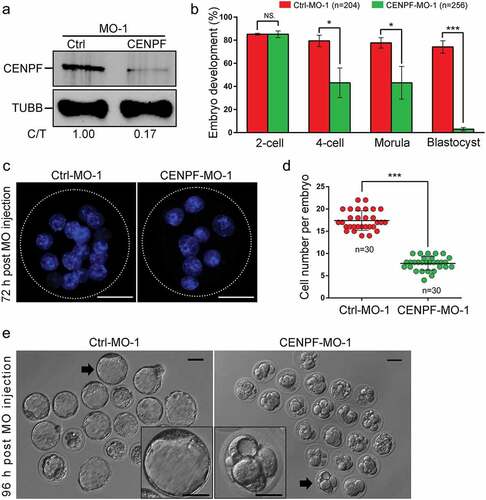
Figure 6. Depletion of CENPF in 2-cell stage embryos by MO injection resulted in early embryo development failure. a. Scheme of injection of 2-cell stage embryos for the three MO experimental groups. Both blastomeres of a 2-cell stage embryo were injected with Ctrl-MO, defined as “Ctrl-Ctrl”. One blastomere of a 2-cell stage embryo was injected with Ctrl-MO and the other blastomere was injected with CENPF-MO, defined as “Ctrl-CENPF”; both two blastomeres of 2-cell were injected with CENPF-MO, defined as “CENPF-CENPF”. b. Western blot analysis after CENPF-MO injection. 2-cell stage oocytes injected with MO were cultured to the morula stage prior to sample collection. The results of one representative experiment of three independent replicates are presented. TUBB was used as a loading control. c. CENPF-MO injection in 2-cell stage embryos caused early embryo development failure. Different superscripts (a, b, and c) on the bars indicate statistical difference (P < 0.01). d. Morphology of embryos. White-dashed lines indicate embryos. DNA was stained with Hoechst 33342. Scale bar, 30 μm. e. Cell numbers per embryo 48 h after MO injection of 2-cell stage embryos. Quantified data are shown as mean ± S.D. ***P < 0.001. f. Image of embryos 48 h and 72 h after MO injection. Black arrows indicate the embryos with blastocoels. Scale bar, 50 μm. g. Time-lapse imaging of 2-cell stage embryo after Ctrl-MO (red) or CENPF-MO (green) injection.
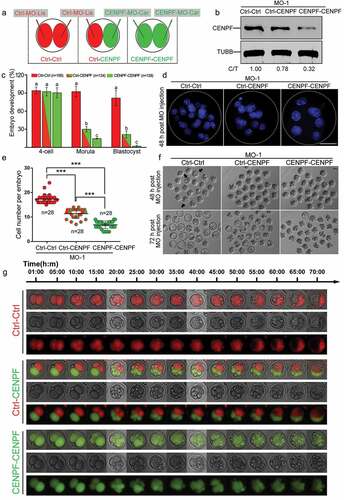
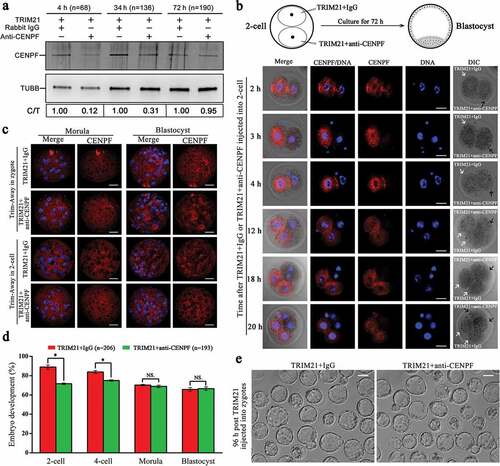
Figure 7. Depletion of CENPF using Trim-Away approach resulted in early embryo development failure. a. CENPF expression analysis after Trim-Away in zygotes. Zygotes injected with TRIM21+ IgG or TRIM21+ anti-CENPF were cultured to 4 h, 34 h and 72 h for western blot analysis. TUBB was used as a loading control. The results of one representative experiment of three independent replicates are presented. b. CENPF localization at 2 h, 3 h, 4 h, 12 h, 18 h, and 20 h after TRIM21+ IgG and TRIM21+ anti-CENPF injected into different blastomeres of 2-cells. White arrows showed the blastomere injected with TRIM21+ IgG, and black arrows showed the blastomere injected with TRIM21+ anti-CENPF. DNA was stained with Hoechst 33342. Scale bar, 20 μm. c. CENPF localization in morula (72 h or 48 h) and blastocyst (96 h or 72 h) after TRIM21 + IgG and TRIM21 + anti-CENPF injected into zygotes or 2-cells. Embryos were stained with anti-CENPF antibody. DNA was stained with Hoechst 33342. Scale bar, 20 μm. d. TRIM21+ anti-CENPF injection into zygotes caused early embryo development failure. Quantified data are shown as mean ± S.D. *P < 0.05. e. Image of blastocyst at 96 h after TRIM21 + IgG or TRIM21 + anti-CENPF injected into zygotes. Scale bar, 50 μm.