Figures & data
Table 1. Primer sequences
Figure 1. Blood-retinal barrier in the OIR model mice was protected by Astragalus root extract. (a) Comparison of EB leakage of blood-retinal barrier in neonatal mice; (b) observation of ADP enzyme staining of retina (× 50–100); The data in the figure were measured in the form of mean ± standard deviation. One-way ANOVA was involved for comparison between multiple groups, and LSD-t-test was used for pairwise comparison after ANOVA analysis. * P < 0.05 vs. the normal group, # P < 0.05 vs. the OIR group, N = 10
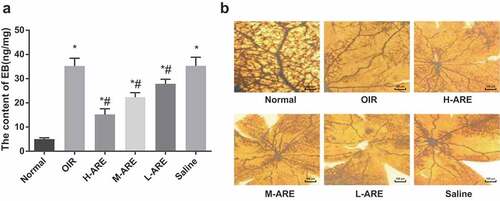
Figure 2. Retinal vascular angiogenesis in the OIR model mice was improved by Astragalus root extract. (a) HE staining of retinal tissues of neonatal mice (200 ×); (b) Comparison of retinal neovascular endothelial cell nuclei in neonatal mice; the data in the figure are all measurement data, using the mean ± standard deviation. One-way ANOVA was taken for comparison among groups, and LSD-t-test was used for pairwise comparison after ANOVA analysis. * P < 0.05 vs. the normal group, # P < 0.05 vs. the OIR group, N = 10
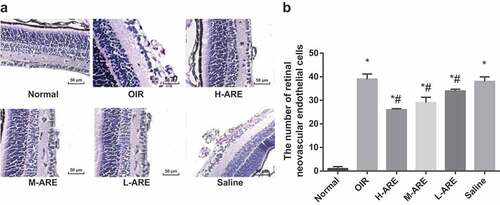
Figure 3. The ultrastructure of retina in OIR model mice was improved by Astragalus root extract. (a) Electron microscopic observation of retinal ultrastructure in neonatal mice in each group; (b) Fluorescence probe CellROX was used to detect the expression of reactive oxygen species in the retina of each group of mice; the data in the figure are all measurement data, by using the mean ± standard deviation form, one-way ANOVA was used for multiple groups comparison, and LSD-t-test was used for the pairwise comparison after ANOVA analysis. * P < 0.05 vs. the normal group; # P < 0.05 vs. the OIR group, N = 10
Figure 4. Bcl-2 in the OIR model mice was promoted and Bax was suppressed by Astragalus root extract. (a) TUNEL assay was used to detect the apoptosis of retina in each group; (b) The mRNA expression of Bax and Bcl-2 in the retina of newborn mice in each group detected by RT-qPCR; (c) Protein bands of Bax and Bcl-2 in the retina of newborn mice; (d) Protein expression Bax and Bcl-2 in the retina of newborn mice in each group detected by western blot analysis. The data are all measurement data, by using the mean ± standard deviation form, the comparison among multiple groups using one-way ANOVA, and LSD-t-test was used after ANOVA analysis. * P < 0.05 vs. the normal group; # P < 0.05 vs. the OIR group, N = 10
Figure 5. VEGF expression was reduced and PEDF expression was increased by Astragalus root extract in retina of the OIR model mice (a) immunohistochemical detection of positive expression of VEGF in retinal tissue of newborn mice (200 ×); (b) Comparison of positive expression of VEGF in retinal tissue of newborn mice in each group; (c). Immunohistochemical detection of PEDF positive expression in retina tissue of newborn mice (200 ×); (d) Comparison of positive expression of PEDF in retinal tissues of newborn mice from all group. The data in the figure are all measurement data, in the form of mean ± standard deviation, and the comparison among groups was analyzed by one-way ANOVA. The LSD-t-test was taken for pairwise comparison after ANOVA analysis; * P< 0.05 vs. the normal group; # P < 0.05 vs. the OIR group, N = 10
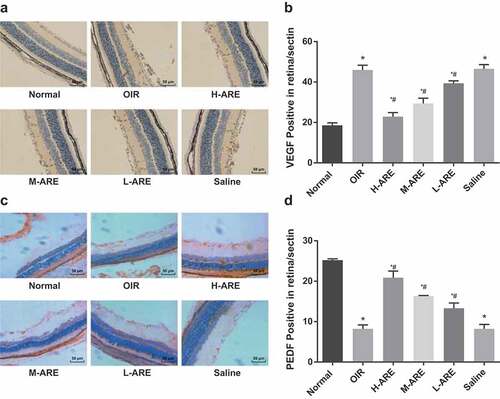
Figure 6. VEGF and HIF-1α were inhibited, while PEDF and IGF-1 were promoted by Astragalus root extract in retinal tissues of the OIR model mice (a) The expression of VEGF, HIF-1α, PEDF, and IGF-1 mRNA in the retina of newborn mice in each group detected by RT-qPCR; (b) The protein bands of VEGF, HIF-1α, PEDF, and IGF-1 in the retina of newborn mice; (c) Statistical analysis of protein expression in Figure b. The data are all measurement data, in the form of mean ± standard deviation, and the comparison among groups was analyzed by one-way ANOVA. The LSD-t-test was used for pairwise comparison after ANOVA analysis; * P< 0.05 vs. the normal group; # P < 0.05 vs. the OIR group, N = 10
Figure 7. iNOS expression was promoted while eNOS and nNOS were inhibited by Astragalus root extract in the retina of the OIR model mice. (a) The mRNA expression of eNOS, nNOS and iNOS in the retina of newborn mice of each group detected by RT-qPCR; (b) Protein bands of eNOS, nNOS and iNOS in the retina of newborn mice; (c) The protein expression of eNOS, nNOS and iNOS in the retina of newborn mice of each group detected by western blot analysis. The data in the figure are all measurement data, in the form of mean ± standard deviation, and the comparison among groups was analyzed by one-way ANOVA. The LSD-t-test was used for pairwise comparison after ANOVA analysis; * P < 0.05 vs. the normal group; # P < 0.05 vs. the OIR group, N = 10