Figures & data
Table 1. Primer sequence
Figure 1. Inhibited miR-183 and overexpressed Foxp1 attenuate EP progression. (a), epileptic seizure in rats; (b-c), the results of EEG monitoring of rats in each group on the 7th day, * P < 0.05 vs the normal group, + P < 0.05 vs the EP + Antagomir-NC group, # P < 0.05 vs the EP + oe-NC group, & P < 0.05 vs the EP + Antagomir-miR-183 + siRNA-NC group. N = 10, the measurement data conforming to the normal distribution were performed as mean ± standard deviation, one-way ANOVA was employed for comparisons among multiple groups, and Tukey’s post hoc test was used for pairwise comparisons after one-way ANOVA
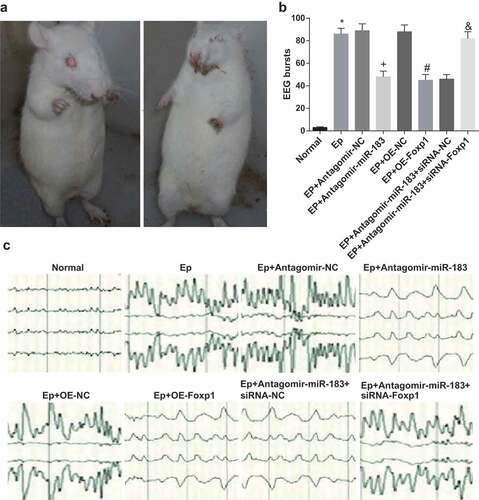
Figure 2. Inhibited miR-183 and overexpressed Foxp1 repress hippocampal neuron injury in EP rats. (a), results of rats’ neuron staining observation in each group (400 ×); (b), comparison of ultrastructure of rats’ hippocampus pyramidal cells among the groups (7500 ×); (c-d), comparison of rats’ neuron injury among the groups (200 ×), * P < 0.05 vs the normal group, + P < 0.05 vs the EP + Antagomir-NC group, # P < 0.05 vs the EP + oe-NC group, & P < 0.05 vs the EP + Antagomir-miR-183 + siRNA-NC group. N = 5, the measurement data conforming to the normal distribution were performed as mean ± standard deviation, one-way ANOVA was employed for comparisons among multiple groups, and Tukey’s post hoc test was used for pairwise comparisons after one-way ANOVA
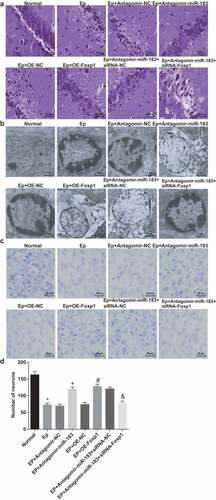
Figure 3. Inhibited miR-183 and overexpressed Foxp1 suppress neuron apoptosis in hippocampus of EP rats. (a), FJC positive degeneration neurons of rats (400 ×); (b), results of TUNEL staining observation (400 ×); (c), results of Hoechst 33258 staining observation (400 ×) of rats’ hippocampus; (d), neuron apoptotic rates of rats’ hippocampus; (e), mRNA expression of Bax and Bcl-2 were detected by RT-qPCR; (f), the statistical results of protein expression of Bax and Bcl-2 in rats’ hippocampus; (g), protein bands of Bax and Bcl-2 in rats’ hippocampus, 1–8 indicated the normal group, the EP group, the EP + Antagomir-NC group, the EP + Antagomir-miR-183 group, the EP + oe-NC group, the EP + oe-Foxp1 group, the EP + Antagomir-miR-183 + siRNA-NC group and the EP + Antagomir-miR-183 + siRNA-Foxp1 group, respectively. * P < 0.05 vs the normal group, + P < 0.05 vs the EP + Antagomir-NC group, # P < 0.05 vs the EP + oe-NC group, & P < 0.05 vs the EP + Antagomir-miR-183 + siRNA-NC group. N = 5, the measurement data conforming to the normal distribution were performed as mean ± standard deviation, one-way ANOVA was employed for comparisons among multiple groups, and Tukey’s post hoc test was used for pairwise comparisons after one-way ANOVA
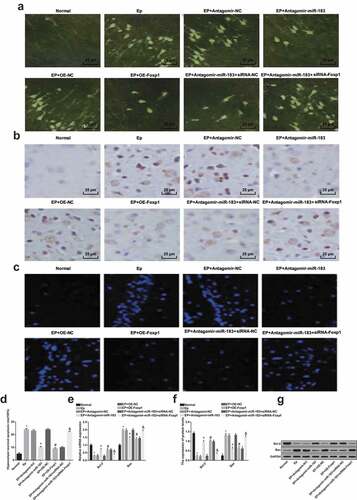
Figure 4. Inhibited miR-183 and overexpressed Foxp1 restrict neuron apoptosis in hippocampus of EP rats. (a), representative images of FDA/PI staining (400 ×); (b), statistical results of ratio of apoptotic neurons and survival neurons after the rats’ hippocampal tissues conducted with FDA/PI staining. * P < 0.05 vs the normal group, + P < 0.05 vs the EP + Antagomir-NC group, # P < 0.05 vs the EP + oe-NC group, & P < 0.05 vs the EP + Antagomir-miR-183 + siRNA-NC group. N = 5, the measurement data conforming to the normal distribution were performed as mean ± standard deviation, one-way ANOVA was employed for comparisons among multiple groups, and Tukey’s post hoc test was used for pairwise comparisons after one-way ANOVA
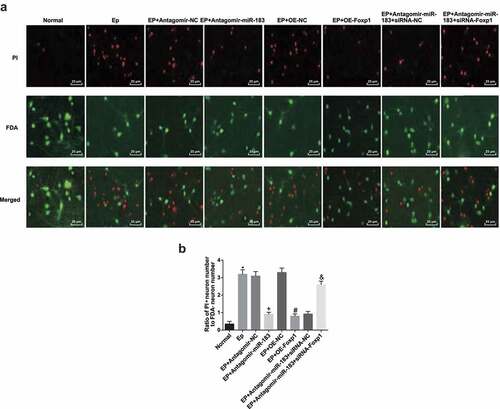
Figure 5. Inhibited miR-183 up-regulates Foxp1 and inactivates the Jak/Stat signaling pathway in EP. (a), expression of miR-183, Foxp1, Jak1, Stat1, and Stat3 were detected by RT-qPCR; (b), the statistical results of protein expression of Foxp1, Jak1, Stat1, and Stat3 in rats’ hippocampus; (c), protein bands of Foxp1, Jak1, Stat1, and Stat3 in rats’ hippocampus, 1–8 indicated the normal group, the EP group, the EP + Antagomir-NC group, the EP + Antagomir-miR-183 group, the EP + oe-NC group, the EP + oe-Foxp1 group, the EP + Antagomir-miR-183 + siRNA-NC group and the EP + Antagomir-miR-183 + siRNA-Foxp1 group, respectively. * P < 0.05 vs the normal group, + P < 0.05 vs the EP + Antagomir-NC group, # P < 0.05 vs the EP + oe-NC group, & P < 0.05 vs the EP + Antagomir-miR-183 + siRNA-NC group. N = 5, the measurement data conforming to the normal distribution were performed as mean ± standard deviation, one-way ANOVA was employed for comparisons among multiple groups, and Tukey’s post hoc test was used for pairwise comparisons after one-way ANOVA
Figure 6. Inhibited miR-183 and overexpressed Foxp1 promote neuron proliferation in EP rats. (a), observation of neuron morphology of rats’ hippocampus (200 ×); (b), expression of NF of neurons in rats’ hippocampus; (c), comparison of cell proliferation ability among the groups; (d), positive cells in EdU staining of each group; (e), representative images of EdU staining (400 ×), * P < 0.05 vs the control group, + P < 0.05 vs the EP + inhibitor NC group, # P < 0.05 vs the EP + oe-NC group, & P < 0.05 vs the EP + miR-183 inhibitor + siRNA-NC group. The experiment was independently repeated for 3 times, the measurement data conforming to the normal distribution were performed as mean ± standard deviation, one-way ANOVA was employed for comparisons among multiple groups, and Tukey’s post hoc test was used for pairwise comparisons after one-way ANOVA
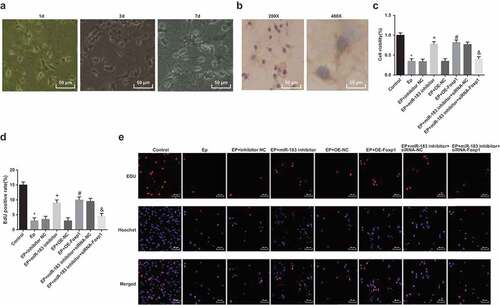
Figure 7. Inhibited miR-183 and overexpressed Foxp1 suppress neuron apoptosis in EP. (a), apoptosis was detected by Hoechst 33342 staining; (b), apoptosis was detected by flow cytometry; (c), comparison of apoptotic rates among the groups; (d), mRNA expression of Bcl-2 and Bax was detected by RT-qPCR; (e), statistical results of protein expression of Bcl-2 and Bax; F, protein bands of Bcl-2 and Bax, 1–8 indicated the control group, the EP group, the EP + inhibitor NC group, the EP + miR-183 inhibitor group, the EP + oe-NC group, the EP + oe-Foxp1 group, the EP + miR-183 inhibitor + siRNA-NC group and the EP + miR-183 inhibitor + siRNA-Foxp1 group, respectively. * P < 0.05 vs the control group, + P < 0.05 vs the EP + inhibitor NC group, # P < 0.05 vs the EP + oe-NC group, & P < 0.05 vs the EP + miR-183 inhibitor + siRNA-NC group. The experiment was independently repeated for 3 times, the measurement data conforming to the normal distribution were performed as mean ± standard deviation, one-way ANOVA was employed for comparisons among multiple groups, and Tukey’s post hoc test was used for pairwise comparisons after one-way ANOVA
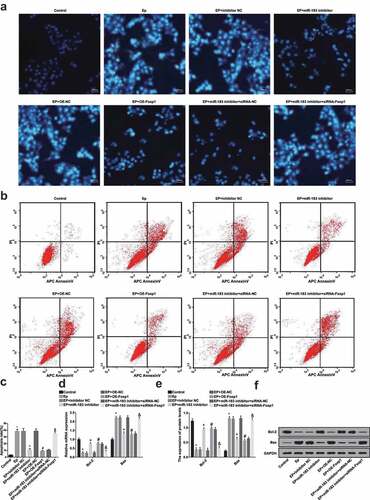
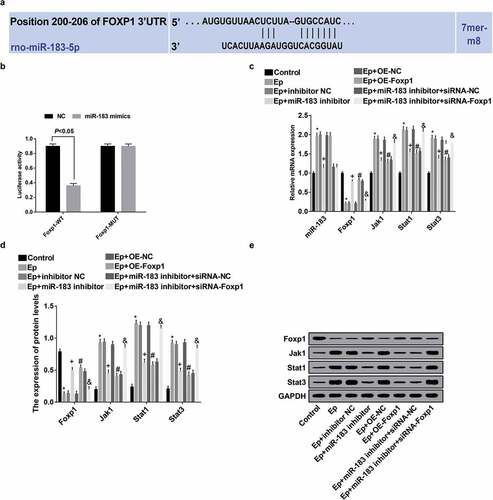
Figure 8. Inhibited miR-183 inactivates the Jak/Stat signaling pathway in EP rats by targeting Foxp1. (a), predicted binding sites of miR-183 on Foxp1 3ʹUTR; (b), detection of luciferase activity between miR-183 on Foxp1; (c), the expression of miR-183, Foxp1, Jak1, Stat1, and Stat3 was detected by RT-qPCR; (d), statistical results of protein expression of Foxp1, Jak1, Stat1, and Stat3; (e), protein bands of Foxp1, Jak1, Stat1, and Stat3, 1–8 indicated the control group, the EP group, the EP + inhibitor NC group, the EP + miR-183 inhibitor group, the EP + oe-NC group, the EP + oe-Foxp1 group, the EP + miR-183 inhibitor + siRNA-NC group and the EP + miR-183 inhibitor + siRNA-Foxp1 group, respectively. * P < 0.05 vs the control group, + P < 0.05 vs the EP + inhibitor NC group, # P < 0.05 vs the EP + oe-NC group, & P < 0.05 vs the EP + miR-183 inhibitor + siRNA-NC group. The experiment was independently repeated for 3 times, the measurement data conforming to the normal distribution were performed as mean ± standard deviation, one-way ANOVA was employed for comparisons among multiple groups, and Tukey’s post hoc test was used for pairwise comparisons after one-way ANOVA