
Figures & data
Figure 1. Mutations of the phosphorylation sites of CAC1.
(a) Sequence of Cac1p. Sites of phosphorylation investigated in this study are shown in bold/underline. (b) Single, double and triple mutations analyzed in this study. “*” depicts CDK phosphorylation sites; “^” depicts putative DDK phosphorylation sites. (c) Growth curves of a cac1∆ strain expressing pRS315-CAC1 with the indicated S→A mutations. One of three independent experiments with all strains grown in parallel in the same 96 well-plate is shown.
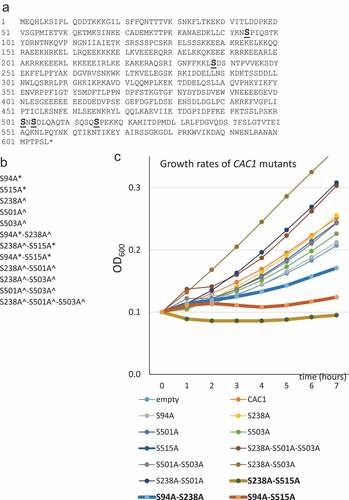
Figure 2. Protein and plasmid stability in CAC1 mutants and association with PCNA
(a) Expression of mutant Cac1p proteins. Exponentially growing cells were boiled in the presence of SDS/urea and equal amounts of proteins were analyzed by Western blot with anti-FLAG or and anti-actin antibodies. (b) Plasmid loss in CAC1 mutants. Plasmid loss per generation in BY4742 and cac1∆ strains harboring the pRS315-CAC1 plasmid with the CAC1 mutations shown on the horizontal axis and a control mcm5-1 strain harboring pRS315 was measured and calculated as in [Citation21] and plotted. (c) cac1∆ cells expressing pRS315-CAC1 with the indicated S→A mutations were lysed and immunoprecipitated with anti-FLAG antibodies followed by Western blotting with anti-FLAG and anti-PCNA antibodies. The arrows on the right point the position of PCNA and the cross-reacting Ig-light chain in the immunoprecipitates.
Figure 3. Deregulation of cell cycle in CAC1 mutants
(a) Pictures of exponentially growing cells at 63 x magnification. (b) Exponentially growing cells (shown below the graphs) were stained with propidium iodide and the DNA content was measured by flow cytometry and plotted. G1 and G2/M peaks are shown above the histograms.
Figure 4. Mutation rates and sensitivity to DNA damage
(a) MMS sensitivity. Exponentially growing cac1∆ cells harboring pRS315-CAC1 with the indicated S→A mutations were serially diluted and spotted on SC-leu plates containing 0.005%, 0.01% and 0.02% MMS. Spots containing equal number of cells are shown. One of two independent experiments is shown. (b) Spontaneous mutation rates in CAC1 mutants as measured by canavanine resistance assay. Four independent liquid cultures originating from isolated single colonies on agar plates were grown for each strain (shown at the bottom) and 107 cells were spread on SC-leu-arg plates containing 60 µg/ml canavanine (Sigma). Plates were incubated for three days and CanR colonies were counted and plotted using the “stock” graph by MSExcel©.
Figure 5. Flocculation in S94A-S238A and S238A-S515A mutants
(a) BY4742 and cac1∆ cells expressing mutant CAC1 as shown were grown in liquid cultures, the tubes then were rested for 5–10 min and photographed. (b) RNA was isolated from exponentially growing cac1∆ mutants (shown on the horizontal axis) and the abundance of FLO1, FLO5, FLO9, FLO10 and FLO11 was measured by quantitative RT-PCR and plotted. Three independent experiments are shown.
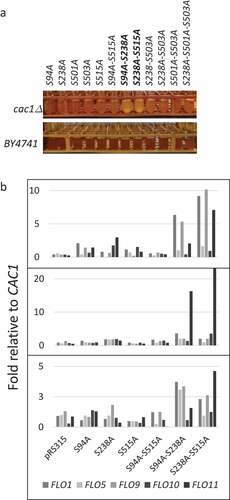
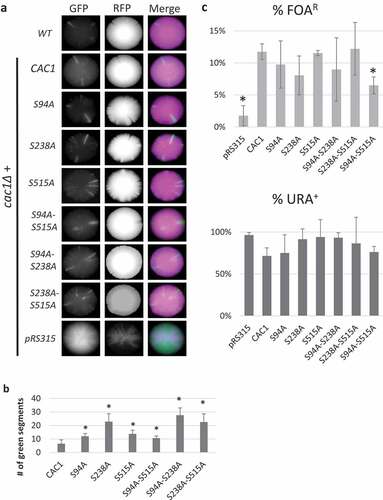
Figure 6. Analysis of silencing at Sir2p-regulated loci
(a) cac1∆ cells harboring pRS315-CAC1 with the indicated S→A mutations, the CRASH HML:CRE and the CRASH RFP/GFP reporter cassettes were grown for 5–7 days and imaged with AxioZoom microscope with Zen blue software. Representative photos are shown for each strain. (b) The number of green segments was counted for 4–5 colonies from each strain, with the exception of the strain with empty vector (pRS315) in which the extent of the green signal made it impossible to identify segments. Average values are shown with error bars denoting a standard error. * indicates a p < 0.05. (c) Sub-telomeric silencing was assessed using a URA3 reporter at the VIIL telomere as described in the text. Bars show the average percentage of colonies growing on SC-ura-leu or SC-leu+FOA. Average results of three biological replicas are shown. Error bars show standard error. * denotes p < 0.05.
Supplemental material