Figures & data
Figure 1. Effects of cardamonin (CAD) in acute colitis. Wild-type mice were challenged with 3% DSS for five days; CAD (40mg/kg) or vehicle was administrated every other day starting from day 0. Disease progression was assessed daily. (a) Representative morphological changes of the colon at day 10. (b) Colon length of mice was measured after sacrifice. *p < 0.05 by ANOVA. (c) Weight loss was monitored every day. *p < 0.05 by Two-way ANOVA. D Average clinical score including weight loss value, stool consistency and rectal bleeding. *p < 0.05 by ANOVA. Black bar, 1cm; Data represent means±SEM
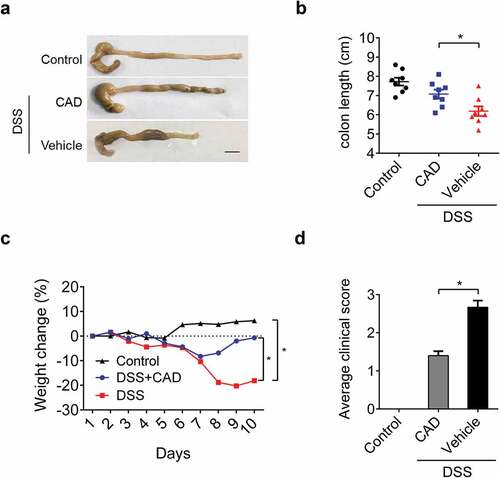
Figure 2. Cardamonin attenuates the development of recurring colitis. Mice were administrated with three rounds of 2.5% DSS for five days; each round was followed by two weeks of normal water to induce recurring colitis. (a) Weight change was monitored in the recurring colitis model. *p < 0.05 by Two-way ANOVA. (b) The length of colon was measured on day 60. *p < 0.05 by ANOVA. (c) Representative histopathology of colon tissues. Original magnification, ×200. (d-e) Colon was homogenized and amounts of IL-1β and TNF-α in supernatants were assayed by ELISA. *p < 0.05, **p < 0.01 by ANOVA. Data represent means±SEM
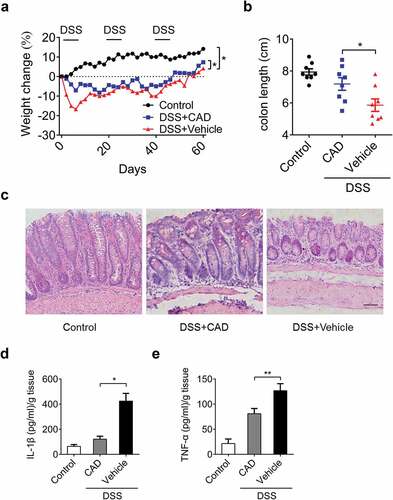
Figure 3. CAD can protect mice in colitis-associated colon carcinoma. (a) Experimental protocol for colitis-associated colon carcinoma model. (b) Weight changes were measured during the whole course. **p < 0.01 by Two-way ANOVA. (c) Length of the colon on day 90. *p < 0.05 by ANOVA. (d-e) Colon was homogenized and amounts of IL-1β and TNF-α in supernatants were assayed by ELISA. *p 0.05 by ANOVA. Data represent means ± SEM
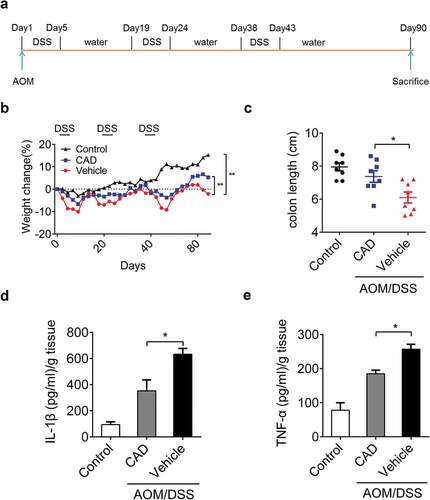
Figure 4. CAD attenuates tumorigenesis during CACC. The number (a) and average size (b) of polyps in colons harvested from mice in the CACC model. (c) Representative histopathology of paraffin-embedded colon sections. (d) Percent of tumor area in representative histopathology sections by Image pro plus (IPP). (e) Ki67 expression was assessed by IHC from colon tissues. (f) Percent of Ki67 positive cells in each HPF was quantified by IPP. Scale bar, 50 μm; Data represent means±SEM, *p < 0.05 by two-tailed Student’s t test
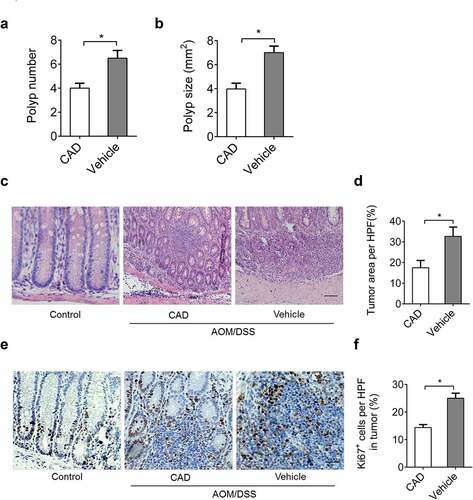
Figure 5. CAD inhibits cell proliferation and chemokine secretion in vitro. CAD (30 μM) was given to colon cancer cells. Cell viability of HT-29 (a) and SW-460 cells (b) was assessed by CCK-8 assay. mRNA levels of Ki67 in HT-29 (c) and SW-460 cells (d) were detected by qPCR. Levels of IL-1β and TNF-α in supernatants of HT-29 (e) and SW-460 cells (f) were assayed by ELISA. Data represent means±SEM, *p < 0.05, **p < 0.01 by two-tailed Student’s t test
Figure 6. STAT3 activation was reduced in the colon tumors from CAD group. (a) Immunofluorescence assay showing localization of activated STAT3 in colon tissue. (b) Levels of p-JAK2, p-STAT1, p-STAT3 and p-STAT5 in colon tissue were analyzed by western blotting. (c) The western blot data were quantified by using Image J software. Scale bar, 25 μm; Data represent means±SEM, *p < 0.05, **p < 0.01 by ANOVA
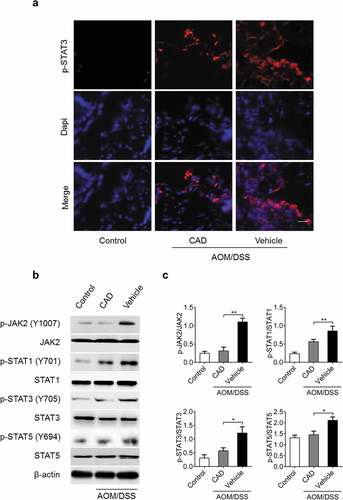
Figure 7. Reduction of cell viability and inflammation factors in colon tumor cells was associated with inhibited STAT3 pathway. CAD was added to HT-29 and SW-460 cell cultures after stimulated by IL-6 (50 ng/ml). Expressions of p-JAK2, p-STAT1, p-STAT3 and p-STAT5 in HT-29 (a) and SW-460 cells (b) were detected by western blotting. The western blot data of HT-29 (c) and SW-460 cells (d) were quantified by using Image J software. (e) Levels of IL-1β and TNF-α in supernatants of HT-29 cells were assayed by ELISA. (f) Levels of IL-1β and TNF-α in SW-460 cells. Cell viabilities of HT-29 (g) and SW-460 cells (h) were analyzed by CCK-8 assay. Data represent means±SEM, *p < 0.05, **p < 0.01 by ANOVA