
Figures & data
Figure 1. Rig-I deficiency lead to the premature aging phenotypes. (a) Representative image and summary data comparing the fur status of 52-week WT and Rig-I-/- mice. The mice were scored 0–4: 4 is fur seen in young WT mice, and 0 is most reduced. Left panels: representative images of 52-week WT and Rig-I-/- mice. Right panel: fur score in 52-week WT and Rig-I-/- mice (n = 8). (b) Summary data comparing the responsiveness to gentle physical stimuli in 52-week WT and Rig-I-/- mice (n = 8). The mice were scored 0–3: 3 is very active, and 0 is inactive. (c) Kaplan-Meier curves showing the cumulative survival rates of WT and Rig-I-/- mice (n = 16 and 18, respectively). (d–e) Representative dot plot and summary data comparing the percentage of Ki-67+ (d) or apoptotic (e) BM cells in WT and Rig-I-/- mice (n = 4). (f) Relative mRNA levels of Cdkn2a and Cdkn1a (encoding p16Ink4a and p21Cip1, respectively) by qPCR, and protein levels of p16Ink4a and p21Cip1 by Western blot in BM cells of 52-week WT and Rig-I-/- mice (n = 4). (g) Immunofluorescence staining for p16Ink4a in BM cells of 52-week WT and Rig-I-/- mice. (left panel: representative images for p16Ink4a staining; right panel: the percentage of p16Ink4a staining positive cells; Scale bars: 50 μm). (h) Relative mRNA levels of SASP (Il-1β, Il-6, Il-8, Ccl2 and Cxcl1) in BM cells of 52-week WT and Rig-I-/- mice (n = 4). (i) Relative mRNA levels of Cdkn2a and Cdkn1a (encoding p16Ink4a and p21Cip1, respectively) in the liver and kideny tissues of WT and Rig-I-/- mice (n = 4). *p < 0.05; **p < 0.01; ***p < 0.001
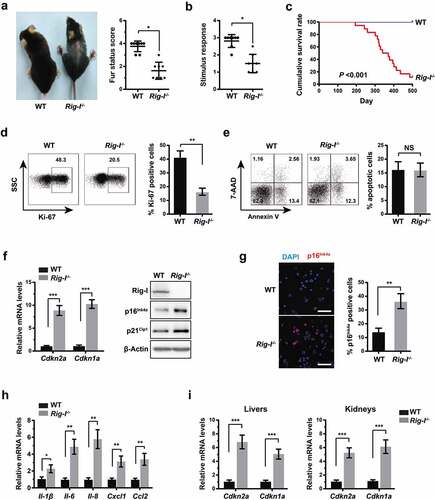
Figure 2. Rig-I deficiency rendered MEFs more susceptible to the serial passages-associated replicative senescence. To assess the effects of Rig-I on aging-dependent proliferation, we established the replicative senescence models of WT and Rig-I-/- MEFs after a limited number of passages. (a) WT and Rig-I-/- MEFs were initially plated at 2 × 10⁵ cells and subcultured at 3‐day intervals, and the cell number counted at the same passages (from P1 to P7) (n = 4). (b) Percentage of Ki-67+ or apoptotic cells in WT and Rig-I-/- MEFs at P7 (n = 4). (c) Representative images and summary data comparing the activity of SA-β-Gal in WT and Rig-I-/- MEFs at P7 (n = 4, Scale bars: 50 μm). (d) Relative mRNA levels of Cdkn2a and Cdkn1a by qPCR, and protein levels of p16Ink4a and p21Cip1 by Western blot in BM cells of 52-week WT and Rig-I-/- mice (n = 4). (e) Relative mRNA levels of SASP – Il-6, Il-8, Il-1β, Ccl2 and Cxcl1 in WT and Rig-I-/- MEFs at P7 (n = 4). (f) Immunofluorescence staining for p16Ink4a in WT and Rig-I-/- MEFs at P7. (left panel: representative images for p16Ink4a staining; right panel: the percentage of p16Ink4a staining positive cells; Scale bars: 50 μm). (g) Growth curve of Rig-I-/- MEFs transduced with vector or Rig-I-expressing plasmid (n = 5). #p Rig-I-/- MEFs with vector versus Rig-I-/- MEFs with Rig-I-expressing plasmid. (h) Summary data comparing the percentage of SA‐β‐gal staining positive cells and the relative mRNA levels of Cdkn2a and Cdkn1a in Rig-I-/- MEFs transduced with vector or Rig-I-expressing plasmid (n = 4). *p < 0.05; **p < 0.01; ***p < 0.001
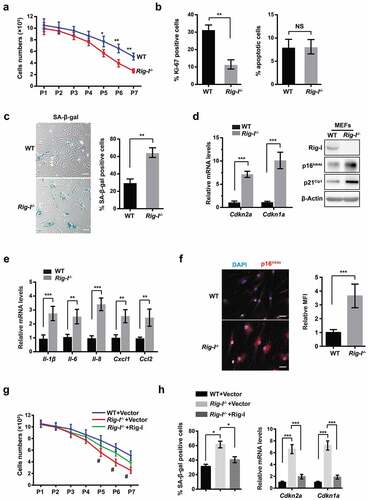
Table 1. Top ranked gene sets enrichment analysis (GSEA) (False discovery rate (FDR) q-value <0.25)
Figure 3. Transcriptome analysis in the tissues of WT and Rig-I-/- mice. (a) KEGG analysis of 52-week WT and Rig-I-/- tissues showing the enrichment of signaling pathways affected by Rig-I. GSEA analysis for the differentially regulated pathways of Rig-I-/- versus WT BM cells, including ECM-receptor interaction (b), focal adhesion (c), cytokine-cytokine receptor interaction (d), actin cytoskeleton regulation (e). False discovery rate (FDR) q-value < 0.25
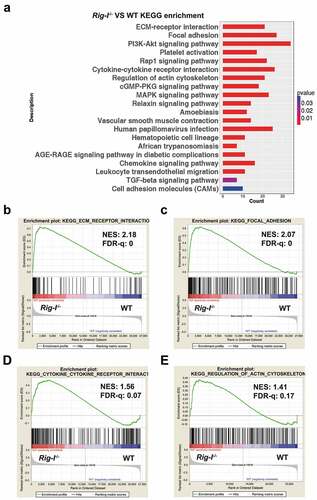
Figure 4. Integrin β3 was negatively regulated by Rig-I. (a) Gene expression profile showing the differences of integrin subunits. Integrin subunits were ranked by the combination of fold change and P value. (b) Relative mRNA levels of Itgb3, Itga2b, Itgad, Itga3, Itga11 and Itgb6 in BM cells of 52-week WT and Rig-I-/- mice. (c) Western blot showing the protein levels of Itgb3 after transfecting FLAG-Rig-I plasmid into Rig-I-/- MEFs. (d) Relative mRNA levels and protein levels of Itgb3, Itga2b and Itgad in pre-senescent (P3) and senescent (P7) WT and Rig-I-/- MEFs. (e) Following Rig-I knockdown by siRNA in WT MEFs, qPCR and Western blot showing the expressing levels of Itgb3, Itga2b and Itga11. (f) Following Rig-I re-expression by transiently transfecting FLAG-Rig-I plasmid into Rig-I-/- MEFs, qPCR and Western blot showing the expressing levels of Itgb3, Itga2b and Itga11. *p < 0.05; **p < 0.01; ***p < 0.001
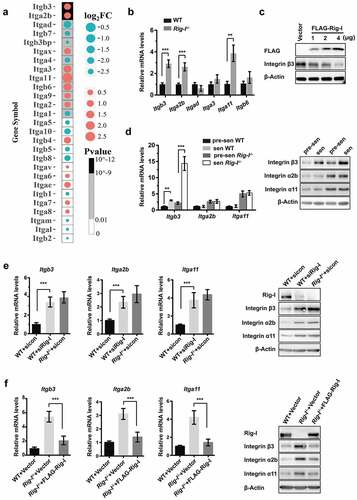
Figure 5. Rig-I deficiency reinforced the integrin β3-mediated senescence. (a–c) WT and Rig-I-/- MEFs were transduced with vector or shRNA targeting Itgb3 (shItgb3) at P3, and then subcultured to P7. (a) Western blot showing the expressions of integrin β3 in WT and Rig-I-/- MEFs at P7. (b) Growth curve of WT and Rig-I-/- MEFs transduced with vector or shItgb3. *p WT MEFs + shItgb3 versus WT MEFs + Vector; #p Rig-I-/- MEFs + shItgb3 versus Rig-I-/- MEFs +Vector; n = 5. (c) Percentage of Ki-67+ and SA‐β‐gal staining positive cells, and relative mRNA levels of Cdkn2a and Cdkn1a in WT and Rig-I-/- MEFs at P7 (n = 4). (d–f) WT and Rig-I-/- MEFs were transduced with empty or Itgb3-expressing vector at P3, and then subcultured to P7. (d) Western blot showing the expressing levels of Itgb3 in WT and Rig-I-/- MEFs at P7. (e) Growth curve of WT and Rig-I-/- MEFs transduced with empty or Itgb3-expressing vector. *p WT MEFs + Itgb3 versus WT + Vector; #p Rig-I-/- MEFs +Itgb3 versus Rig-I-/- MEFs +Vector; n = 5. (f) Percentage of Ki-67+ and SA‐β‐gal staining positive cells, and relative mRNA levels of Cdkn2a and Cdkn1a in WT and Rig-I-/- MEFs at P7 (n = 4). *p < 0.05; **p < 0.01; ***p < 0.001
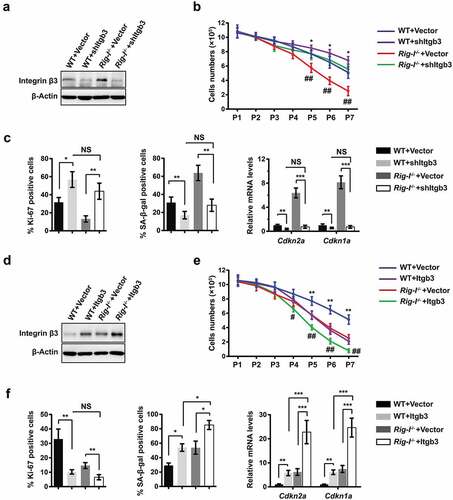
Figure 6. p38 MAPK was crucial for the integrin β3-mediated senescence. (a) Lysates of WT and Rig-I-/- MEFs at the indicated passages (P3, P5 and P7) were analyzed for the expressions of Rig-I, integrin β3, and the activation of p38 MAPK, ERK1/2 (p42/p44) and JNK1/2 by Western blot. The signal intensity ratios are shown at the bottom of the relevant lanes. β-Actin was used as a loading control. (b) Following the treatment with DMSO or p38 MAPK inhibitor – SB202190 (SB, 10μM), summary data showing the percentage of Ki-67+ and SA‐β‐gal staining positive cells, and relative mRNA levels of Cdkn2a and Cdkn1a in WT and Rig-I-/- MEFs at P7 (n = 4). (c) Following Itgb3 knockdown (left) or overexpression (right) in WT MEFs, Western blot showing the protein levels of p-p38 MAPK. (d) Following Rig-I overexpression by transiently transfecting FLAG-Rig-I plasmid into Rig-I-/- MEFs (left) or Rig-I knockdown by siRNA in WT MEFs (right), Western blot showing the protein levels of p-p38 MAPK. (e) p38 MAPK inhibitor – SB20190 was added to WT MEFs transduced with empty or Itgb3-expressing vector. Summary data showing the percentage of Ki-67+ and SA‐β‐gal staining positive cells, and the relative mRNA levels of Cdkn2a and Cdkn1a in WT MEFs at P7 (n = 5). (f) A signaling pathway for the anti-senescence effects of Rig-I. Upon binding to ECM, integrin β3 triggers the phosphorylation of p38 MAPK, which further induces replicative senescence through activating cell cycle inhibitors – p16Ink4a and p21Cip1. In addition, integrin β3 is negatively regulated by Rig-I, and Rig-I deficiency unfetters integrin β3/p38 MAPK signaling to accelerate the processes of cellular senescence. *P < 0.05; **P < 0.01; ***P < 0.001
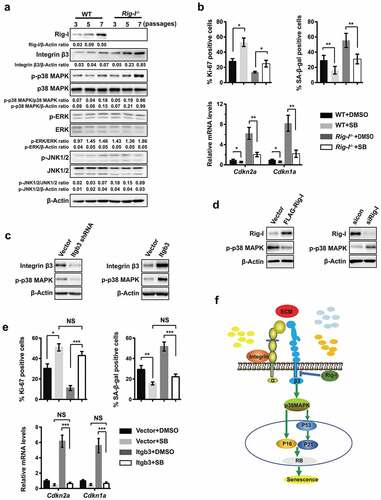
Table 2. Primer sequences