
Figures & data
Table 1. Baseline characteristics of NSCLC patients.
Figure 1. CXCR2 expression in NSCLC tumor tissues and adjacent tissues.IHC staining examples of CXCR2 expression tumor tissues and adjacent tissues (A). IHC semi-quantitative score of CXCR2 expression in tumor tissues and adjacent tissues (B). Percentage of CXCR2 high expression and low expression in tumor tissues and adjacent tissues (C). Comparison of IHC semi-quantitative score of CXCR2 expression was done by paired-samples t-test, and comparison of CXCR2 high expression and low expression between tumor tissues and adjacent tissues was done by McNemar test. P < 0.05 was considered significant. CXCR2, C-X-C Chemokine Receptor Type 2; NSCLC, non-small cell lung cancer.
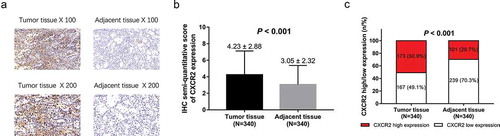
Table 2. Correlation of CXCR2 expression with tumor characteristics.
Figure 2. Comparison of survival between CXCR2 high expression and low expression patients. DFS (A) and OS (B) between CXCR2 high expression and low expression patients. The Kaplan–Meier curves were plotted to show the profiles of DFS and OS between the two groups, and the log-rank test was applied to determine the difference of DFS and OS between the two groups. P < 0.05 was considered significant. CXCR2, C-X-C Chemokine Receptor Type 2; DFS, disease-free survival; OS, overall survival.
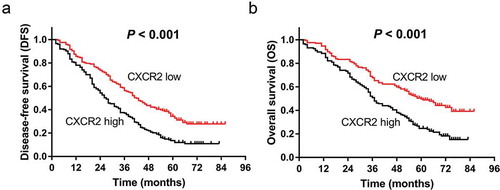
Figure 3. Comparison of survival between CXCR2 high expression and low expression patients in subgroups. DFS between CXCR2 high expression and low expression patients in patients with TNM stage I (A), II (B) and III (C). OS between CXCR2 high expression and low expression patients in patients with TNM stage I (D), II (E) and III (F). Kaplan–Meier curves were plotted to show the profiles of DFS and OS between the two groups, and the log-rank test was applied to determine the difference of DFS and OS between the two groups. P < 0.05 was considered significant. CXCR2, C-X-C Chemokine Receptor Type 2; DFS, disease-free survival; OS, overall survival.

Table 3. Analysis of factors affecting DFS by univariate and multivariate Cox’s proportional hazards regression model.
Table 4. Analysis of factors affecting OS by univariate and multivariate Cox’s proportional hazards regression model.
Figure 4. CXCR2 mRNA and protein expression in different cell lines. The mRNA expression (A) and protein relative expression (B, C) of CXCR2 in NCI-H650, NCI-H1299, NCI-H1437, A549 cells compared with BEAS-2B cells. Comparison of CXCR2 mRNA and protein relative expression between cell lines was conducted by Dunnett’s t-test. P < 0.05 was considered significant. CXCR2, C-X-C Chemokine Receptor Type 2; mRNA, messenger RNA.
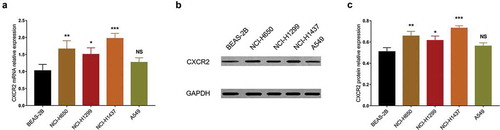
Figure 5. Effect of CXCR2 on cell proliferation and apoptosis. The effect of CXCR2 overexpression and knockdown on CXCR2 mRNA expression (A) and protein relative expression (B,C) in NCI-H1437 cells. The effect of CXCR2 overexpression and knockdown on cell proliferation (D) and apoptosis (E,F,G) in NCI-H1437 cells. The effect of CXCR2 overexpression and knockdown on CXCR2 mRNA expression (H) and protein relative expression (I,J) in NCI-H1299 cells. The effect of CXCR2 overexpression and knockdown on cell proliferation (K) and apoptosis (L,M,N) in NCI-H1299 cells. Comparison of cell proliferation and apoptosis between the two groups was conducted by independent sample’s t-test. P < 0.05 was considered significant. CXCR2, C-X-C Chemokine Receptor Type 2; mRNA, messenger RNA.
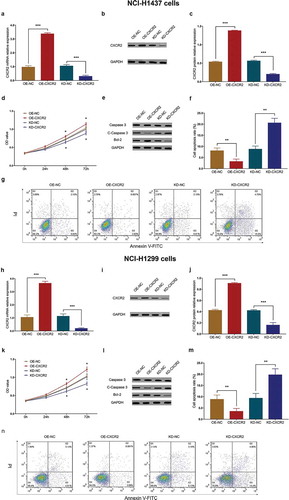
Figure 6. Effect of CXCR2 on cell invasion. The effect of CXCR2 overexpression and knockdown on cell invasion in NCI-H1437 cells (A,B). The effect of CXCR2 overexpression and knockdown on cell invasion in NCI-H1299 cells (C,D). Comparison of invasive cell count between the two groups was conducted by independent sample’s t-test. P < 0.05 was considered significant. CXCR2, C-X-C Chemokine Receptor Type 2.
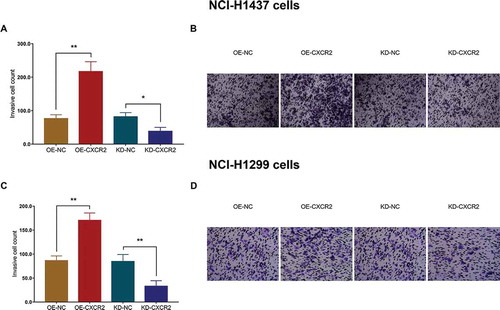
Table 5. Limiting dilution data.
Figure 7. Effect of CXCR2 on CD133+ cell rate and sphere formation efficiency. The effect of CXCR2 overexpression and knockdown on CD133+ cell rate (A,B) and sphere formation efficiency (C,D) in NCI-H1437 cells. The effect of CXCR2 overexpression and knockdown on CD133+ cell rate (E,F) and sphere formation efficiency (G,H) in NCI-H1299 cells. Comparison of CD133+ cell rate and sphere number/1000 cells between the two groups was conducted by independent sample’s t-test. P < 0.05 was considered significant. CXCR2, C-X-C Chemokine Receptor Type 2.
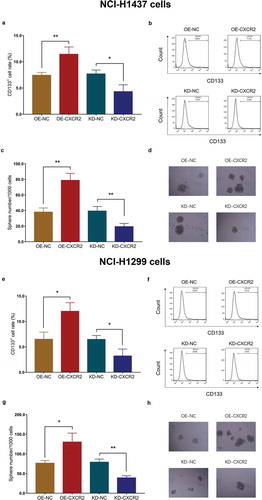
Figure 8. Effect of CXCR2 on chemosensitivity. The effect of CXCR2 overexpression and knockdown on NCI-H1437 cells treated with cisplatin of different concentrations (A) and NCI-H1437 cells treated with gemcitabine of different concentration (B). The effect of CXCR2 overexpression and knockdown on IC50 value of cisplatin or gemcitabine in NCI-H1437 cells (C). The effect of CXCR2 overexpression and knockdown on NCI-H1299 cells treated with cisplatin of different concentrations (D) and NCI-H1299 cells treated with gemcitabine of different concentration (E). The effect of CXCR2 overexpression and knockout on IC50 value of cisplatin or gemcitabine in NCI-H1299 cells (F) Comparison of relative cell viability and IC50 value between the two groups was conducted by independent sample’s t-test. P < 0.05 was considered significant. CXCR2, C-X-C Chemokine Receptor Type 2.
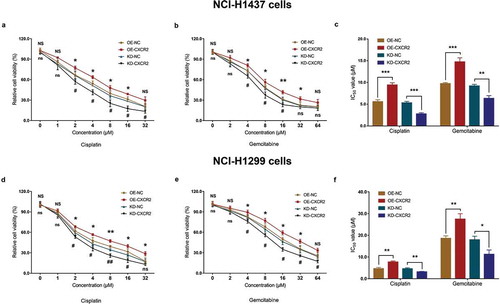
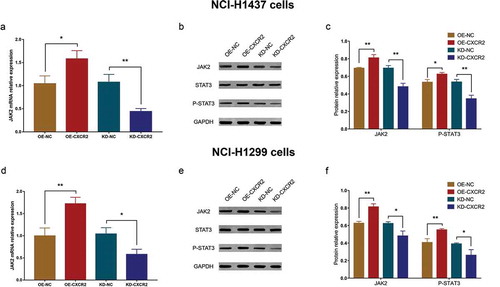
Figure 9. Effect of CXCR2 on JAK2/STAT3 pathway. The effect of CXCR2 overexpression and knockdown on JAK2 mRNA (A) as well as JAK2 and P-STAT3 protein expression (B,C) in NCI-H1437 cells. The effect of CXCR2 overexpression and knockdown on JAK2 mRNA (D) as well as JAK2 and P-STAT3 protein expression (E,F) in NCI-H1299 cells. Comparison of mRNA expression and protein relative expression between groups was conducted by independent sample’s t-test. P < 0.05 was considered significant. CXCR2, C-X-C Chemokine Receptor Type 2; JAK2, janus kinase 2; STAT3, signal transductor and activator of transcription 3.
Supplemental Material
Download PDF (86.5 KB)Data availability statement
The datasets used and/or analyzed during the current study are available from the corresponding author on reasonable request.