Figures & data
Figure 1. The regulatory role of CK2α on expression of YBX1. (a). Immunoblotting assessment of CK2α and YBX1 in cancer cell lysates, including gastrointestinal stromal tumors (GIST882, GIST-T1, and GIST430), ovarian cancer cell lines (SKOV3, OVCA429, and ES2), non-small cell lung cancer cell lines (PC9 and A549), liver cancer cell lines (HepG2 and Hep3B) and gastric cancer cell lines (AGS, MKN28, and BGC823).(b). Expression of YBX1 was assessed by immunoblotting after treatment with the CK2 inhibitor CX4945 for 48 h. (c). Expressions of YBX1, p-AKT, AKT, cyclin A, and cyclin D1 were evaluated by immunoblotting after the transfection with CK2α siRNA for 72 h in ovarian cancer cell lines (SKOV3 and OVCA429), non-small cell lung cancer cell lines (PC9) and liver cancer cell lines (HepG2). (d). Immunoblotting evaluation of CK2α, p-AKT, AKT, cyclin A, and cyclin D1 after the transfection with YBX1 siRNA for 72 h in ovarian cancer cell lines (SKOV3 and OVCA429) and liver cancer cell lines (HepG2). (e). Immunoblotting evaluation of YBX1 expression after the transfection with wild-type CK2α overexpression vector HA-CK2α or kinase-dead mutation HA-CK2α (K68M) for 72 h in ovarian cancer cell lines (SKOV3 and ES2), non-small cell lung cancer cell lines (PC9) and liver cancer cell lines (HepG2).
Figure 2. CK2α regulated the expression of YBX1 at transcriptional level. (a). The YBX1 transcript levels determined by qRT-PCR after the transfection with wild-type CK2α overexpression vector HA-CK2α or kinase-dead mutation HA-CK2α (K68M) for 48 h in both 293T and HeLa cell lines. (b). The activities of the reporter genes were determined by a dual-luciferase reporter assay system after the transfection with wild-type CK2α overexpression vector HA-CK2α or kinase-dead mutation HA-CK2α (K68M), firefly reporter plasmid and pRL-TK-Renilla for 24 h in 293T and Hela cell lines. The data represent the mean values (±s.d.) of three independent experiments (*p < 0.05, **p < 0.01, ***p < 0.001).
Figure 3. Additive effects were observed through coordinated inhibition of CK2α and YBX1. (a and c) Expression of p-AKT, AKT, cyclin A, cyclin D1, CK2α and YBX1 were assessed by immunoblotting after incubation with CX4945 for 48 h and transfection with YBX1 siRNA for 72 h (a) or 3 days after the transduction with lentiviral CK2α shRNA and/or lentiviral YBX1 shRNA in cancer cell lines (c). (b and d) Cell proliferation was assessed after incubation with CX4945 for 48 h and transfection with YBX1 siRNA for 72 h (b) or 4 days after transduction with lentiviral CK2α shRNA and/or lentiviral YBX1 shRNA in cancer cell lines (d). (e). Colony growth assays were performed after the transduction with lentiviral CK2α shRNA and/or lentiviral YBX1 shRNA for 14 days in cancer cell lines. (f). Cell-cycle analysis was performed after incubation with 2.5 μM CX4945 for 48 h and transfection with YBX1 shRNA for 72 h in SKOV3 cell lines. (g). Wound-healing assays were performed after treatment with CX4945 for 48 h and transfection with YBX1 siRNA for 72 h in cancer cell lines. Scale bar, 50 μm. (h). Transwell migration assays were performed after treatment with CX4945 for 48 h and transfection with YBX1 shRNA for 72 h in cancer cell lines. Scale bar, 50 μm. (i). Wound-healing assays were performed after transduction with lentiviral CK2α shRNA and/or lentiviral YBX1 shRNA for 2 days in cancer cell lines. Scale bar, 50 μm. (j). Transwell migration assays were performed after transduction with lentiviral CK2α shRNA and/or lentiviral YBX1 shRNA for 2 days in cancer cell lines. Scale bar, 50 μm. The data represent the mean values (±s.d.) of three independent experiments (*p < 0.05, **p < 0.01, ***p < 0.001).
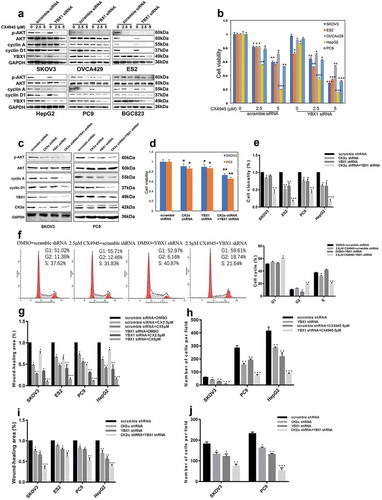
Figure 4. YBX1 is required for CK2α-induced proliferation and migration. (a). Immunoblotting evaluation of p-AKT, AKT, cyclin A, and cyclin D1 after treatment with 5 μM CX4945 for 48 h and transfection with YBX1 plasmids for 72 h in ovarian cancer cell lines (SKOV3). GAPDH staining is a loading control. (b). Cell viability was assessed after treatment with 5 μM CX4945 for 48 h and transfection with YBX1 plasmids for 72 h in ovarian cancer cell lines (SKOV3). Data were normalized to the vector and DMSO, and represent the mean values (± s.d.) from quadruplicate cultures. (c). Cell migration was assessed after treatment with 5 μM CX4945 for 48 h and transfection with YBX1 plasmids for 72 h in ovarian cancer cell lines (SKOV3). Data were normalized to the vector and DMSO, and represent the mean values (± s.d.) from quadruplicate cultures. Scale bar, 50 μm. (d). Immunoblotting evaluation of p-AKT, AKT, cyclin A, and cyclin D1 after treatment with CK2α plasmids and YBX1 siRNA for 48 h in ovarian cancer cell lines (SKOV3). GAPDH staining is a loading control. (e). Cell viability was assessed after treatment with CK2α plasmids and YBX1 siRNA for 48 h in ovarian cancer cell lines (SKOV3). Data were normalized to the vector and scramble siRNA, and represent the mean values (± s.d.) from quadruplicate cultures. (f). Cell migration was assessed after treatment with CK2α plasmids and YBX1 siRNA for 48 h in ovarian cancer cell lines (SKOV3). Scale bar, 50 μm. Data were normalized to the vector and scramble siRNA, and represent the mean values (±s.d.) of three independent experiments (*p < 0.05, **p < 0.01, ***p < 0.001).
Figure 5. Inhibition of PI3K/AKT abolished the proliferation and migration induced by CK2α and YBX1. (a). Immunoblotting evaluation of p-AKT, AKT, cyclin A, and cyclin D1 after treatment with 20 μM LY294002 for 48 h and transfection with CK2α and YBX1 plasmids for 72 h in ovarian cancer cell lines (SKOV3). GAPDH staining is a loading control. (b). Cell viability was assessed after treatment with 20 μM LY294002 for 48 h and transfection with CK2α and YBX1 plasmids for 72 h in ovarian cancer cell lines (SKOV3). (c). Cell migration was assessed after treatment with 20 μM LY294002 for 48 h and transfection with CK2α and YBX1 plasmids for 72 h in ovarian cancer cell lines (SKOV3). Scale bar, 50 μm. Data were normalized to the empty vector and DMSO, and represent the mean values (±s.d.) of three independent experiments (*p < 0.05, **p < 0.01, ***p < 0.001).
Figure 6. Interaction of CK2α and YBX1 in cancer cell lines. (a). CK2α-YBX1 complex was assessed after co-transfection of CK2α and YBX1 through immunoprecipitation followed by immunoblotting in 293T cell lines. (b and c) SKOV3 or GIST882 cell lysates were analyzed via immunoprecipitation and Western blot analysis as shown.
Figure 7. Combination of CK2α knockdown and YBX1 knockdown inhibited the growth of SKOV3 xenografts in mice. (a). Tumors were resected and photographed, and decreased tumor growth was observed following treatment with a combination of CK2α shRNA and YBX1 shRNA. (b and c) Tumor volume and weight were measured after SKOV3 cells with stable shRNA expression were subcutaneously injected in mice for 4 weeks. (d). Western blot confirming CK2α and YBX1 knockdown in resected SKOV3 xenografts with expression of CK2α-targeting shRNA, YBX1-targeting shRNA, and CK2α plus YBX1-targeting shRNA. (e). Xenograft tumors were immunostained with CK2α, YBX1 or Ki67. Relative intensity of the immunostaining was quantified. Scale bar, 50 μm. The data represent the mean values (±s.d.) of three independent experiments (*p < 0.05, **p < 0.01, ***p < 0.001).
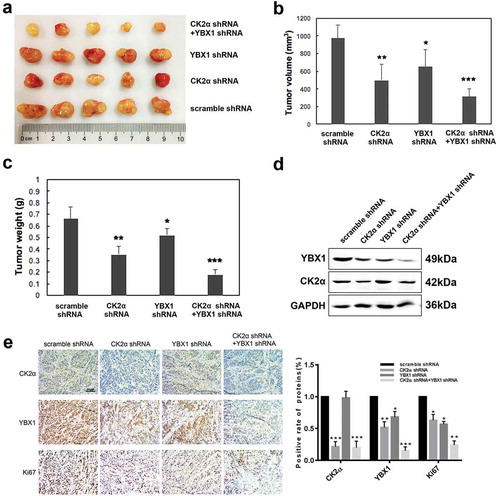
Figure 8. PI3K/AKT antagonist decreases the resistance of doxorubicin induced by co-activation of CK2α and YBX1. Cell proliferation was assessed in cell lines after incubation with doxorubicin for 24 h or/and transfection with CK2α or/and YBX1 plasmids for 72 h or/and 20 μM LY294002 for 48 h in ovarian cancer cell lines (SKOV3). Cell viability was assayed by Cell Proliferation Assay Kit (Promega) method. The data represent the mean values (±s.d.) of three independent experiments.