Figures & data
Figure 1. Notch1 and ETBR are down-regulated in placentas of PE patients. (a) Representative images of immunohistochemistry analysis of Notch1 and ETBR expression in placentas from normal pregnant women and PE women. (b) RT-qPCR analysis of Notch1 and ETBR in placentas from normal pregnant women and PE women. (c) Western blot analysis of Notch1 and ETBR in placentas from normal pregnant women and PE women. * P< 0.05; ** P< 0.01.
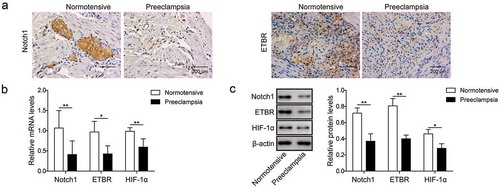
Figure 2. Hypoxia promotes invasion and angiogenesis of trophoblast cells. (a) Transwell invasion assay was used to determine cell invasion of trophoblast cells at 0 h, 6 h and 12 h after hypoxia. (b) Matrigel assay was used to measure angiogenesis of trophoblast cells at 0 h, 6 h and 12 h time after hypoxia. (c) Western blot analysis of related proteins indicated in figures after hypoxia. (d) ELISA analysis of ET-1, TNF-α, sFlt-1 and IL-6 levels at 0 h, 6 h and 12 h after hypoxia. * P< 0.05; ** P< 0.01.
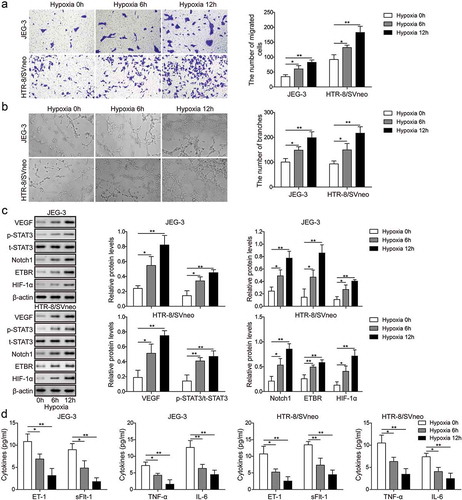
Figure 3. Notch1 promotes invasion and angiogenesis of trophoblast cells. (a) Transwell invasion assay was used to determine cell invasion of control trophoblast cells or cells transfected with NC or Notch1. (b) Matrigel assay was used to measure angiogenesis of control trophoblast cells or cells transfected with NC or Notch1. (c) Western blot analysis of related proteins in control cells or transfected cells. (d) ELISA analysis of ET-1, TNF-α, sFlt-1 and IL-6 levels in control cells or transfected cells. * P< 0.05; ** P< 0.01.
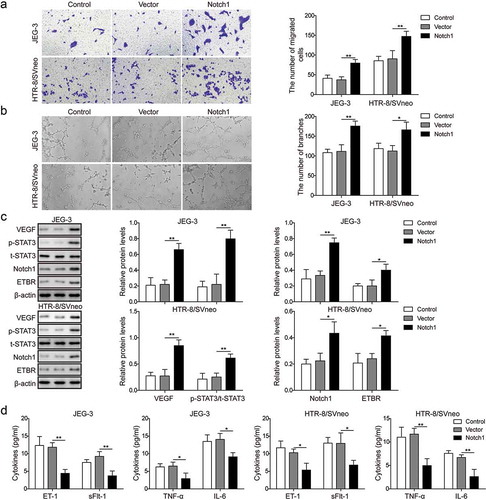
Figure 4. HIF-1α promotes invasion and angiogenesis of trophoblast cells via Notch1/STAT3/ETBR pathway. (a) Transwell invasion assay was used to determine cell invasion of control trophoblast cells or cells treated with shNotch1and/or HIF-1α-overexpressed plasmid. (b) Matrigel assay was used to measure angiogenesis of control trophoblast cells or cells treated withshNotch1and/or HIF-1α-overexpressed plasmid. (c) Western blot analysis of related proteins in control cells or cells treated with shNotch1and/or HIF-1α-overexpressed plasmid. (d) ELISA analysis of ET-1, TNF-α, sFlt-1 and IL-6 levels in control cells or cells treated with shNotch1and/or HIF-1α-overexpressed plasmid. * P< 0.05; ** P< 0.01; ***P< 0.001.
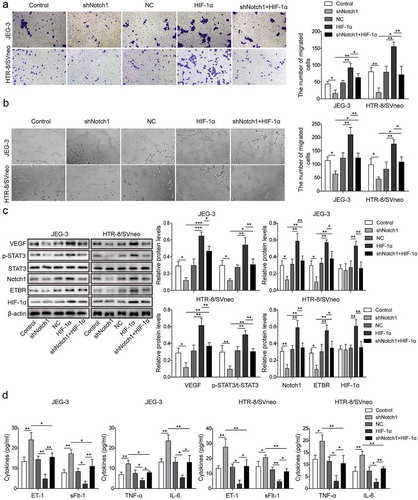
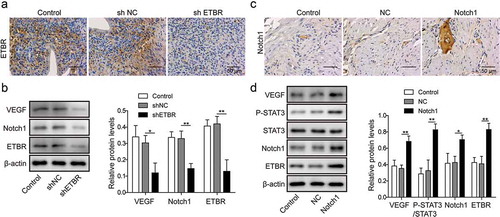
Figure 5. Notch1 and ETBR facilitate angiogenesis of trophoblast cells in RUPP rats. (a) Immunohistochemical staining analysis of ETBR expression in RUPP rats injected with shNC or shETBR. (b) Western blot analysis of related proteins in RUPP rats injected with shNC or shETBR. (c) Immunohistochemical staining analysis of Notch1 expression in RUPP rats injected with NC or Notch1. (d) Western blot analysis of related proteins in RUPP rats injected with NC or Notch1. *P < 0.05; **P < 0.01.