Figures & data
Table 1. The primers used in qRT-PCR
Figure 1. Expressions of miR-92c-3p, FOXP1, autophagy-related proteins, and drug-resistant proteins in ovarian cancer cells. (a) The expression of miR-29c-3p in the DDP-sensitive cell line (SKOV3) and in the DDP-resistant cell line (SKOV3/DDP) was detected using qRT-PCR. (b) The expression of FOXP1, ATG14, and MDR-1, and the expression of FOXP1 in nucleus were detected using Western blot assays. (c) The expression of autophagy-related proteins (LC3-I, LC3-II, P62, and Beclin 1) was detected using Western blot assays. (d) The expression of miR-29c-3p in the DDP-sensitive cell line (A2780) and in the DDP-resistant cell line (A2780/DDP) was detected using qRT-PCR. (e) The expression of FOXP1, ATG14, and MDR-1, and the expression of FOXP1 in nucleus were detected using Western blot assays. (f) The expression of autophagy-related proteins (LC3-I, LC3-II, P62, and Beclin 1) was detected using Western blot assays. Three independent experiments with biological repeats. *P < 0.05, vs. SKOV3 or A2780
Figure 2. Effect of miR-29c-3p on cell viability of DDP-treated ovarian cancer cells. (a) The DDP-sensitive cell line (SKOV3) was transfected with miR-29c-3p inhibitor followed by the DDP treatment with increasing concentrations (0, 1.25, 2.5, 5, 7.5, and 15 μg/mL) for 24 h. Cell viability was detected using the MTT assay. (b) The DDP-resistant cell line (SKOV3/DDP) was transfected with miR-29c-3p mimic followed by the DDP treatment with increasing concentrations (0, 1.25, 2.5, 5.0, 7.5, 15 μg/mL) for 24 h. Cell viability was detected using the MTT assay. (c) The DDP-sensitive cell line (A2780) was transfected with miR-29c-3p inhibitor followed by the DDP treatment with increasing concentrations (0, 1.25, 2.5, 5, 7.5, and 15 μg/mL) for 24 h. Cell viability was detected using the MTT assay. (b) The DDP-resistant cell line (A2780/DDP) was transfected with miR-29c-3p mimic followed by the DDP treatment with increasing concentrations (0, 1.25, 2.5, 5.0, 7.5, 15 μg/mL) for 24 h. Cell viability was detected using the MTT assay. Three independent experiments with biological repeats. *P < 0.05, vs. negative control (NC) or pre-NC
Figure 3. miR-29c-3p directly regulates FOXP1 expression. (a) The binding site between miR-29c-3p and the 3ʹUTR of FOXP1. (b) The luciferase activity of the 3ʹUTR of FOXP1 in SKOV3 cells. (c) The luciferase activity of the 3ʹUTR of FOXP1 in SKOV3/DDP cells. Three independent experiments with biological repeats. *P < 0.05, vs. NC, #P < 0.05, vs. pre-NC
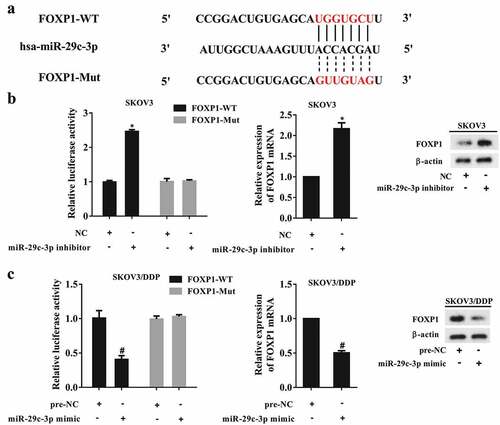
Figure 4. Effect of FOXP1 on ATG14 expression. (a) The interaction of FOXP1 and ATG14 promoter was measured using a ChIP assay. (b) The SKOV3 cells were transfected with pcDNA-FOXP1, and the mRNA and protein levels of ATG14 were detected using qRT-PCR and Western blot assay. (c) The SKOV3/DDP cells were transfected with siRNA-FOXP1, and the mRNA and protein levels of ATG14 were detected using qRT-PCR and Western blot assay. Three independent experiments with biological repeats. *P < 0.05, vs. pcDNA or si-control
Figure 5. miR-29c-3p inhibits ATG14 expression by downregulating FOXP1. (a) The DDP-sensitive cell lines (SKOV3 and A2780) were divided into the NC, miR-29c-3p inhibitor, miR-29c-3p inhibitor + si-control, and miR-29c-3p inhibitor + siRNA-FOXP1 groups. The mRNA expression of ATG14 was detected using qRT-PCR, and the protein levels of FOXP1 and ATG14 were detected using Western blot assay. (b) The DDP-resistant cell lines (SKOV3/DDP and A2780/DDP) were divided into the pre-NC, miR-29c-3p mimic, miR-29c-3p mimic + pcDNA, and miR-29c-3p mimic + pcDNA-FOXP1 groups. The mRNA expression of ATG14 was detected using qRT-PCR, and the protein levels of FOXP1 and ATG14 were detected using Western blot assay. Three independent experiments with biological repeats. *P < 0.05, vs. NC or pre-NC, #P < 0.05, vs. miR-29c-3p inhibitor + si-control or miR-29c-3p mimic + pcDNA
Figure 6. miR-29c-3p controls autophagy by regulating FOXP1/ATG14 pathway. (a) The DDP-sensitive cell lines (SKOV3 and A2780) were divided into the NC, miR-29c-3p inhibitor, miR-29c-3p inhibitor + si-control, miR-29c-3p inhibitor + si-FOXP1, and miR-29c-3p inhibitor + si-FOXP1 + pcDNA-ATG14 groups. Then the cells were treated with rapamycin, which is an agonist of autophagy. The expression of autophagy-related proteins was detected using Western blot assay. (b) The DDP-resistant cell lines (SKOV3/DDP and A2780/DDP) were divided into the pre-NC, miR-29c-3p mimic, miR-29c-3p mimic + pcDNA, miR-29c-3p mimic + pcDNA-FOXP1, and miR-29c-3p mimic + pcDNA-FOXP1 + si-ATG14 groups. Then the cells were treated with 3-MA, which is an antagonist of autophagy. The expression of autophagy-related proteins was detected using Western blot assay. Three independent experiments with biological repeats
Figure 7. miR-29c-3p controls DDP resistance by regulating FOXP1/ATG14 pathway. (a and c) The DDP-sensitive cell lines (SKOV3 and A2780) were divided into the NC, miR-29c-3p inhibitor, miR-29c-3p inhibitor + si-control, miR-29c-3p inhibitor + si-FOXP1, and miR-29c-3p inhibitor + si-FOXP1 + pcDNA-ATG14 groups. Cell viability was detected using the MTT assay, and protein levels of ATG4 and MDR-1 were detected using Western blot assay. (b and d) The DDP-resistant cell lines (SKOV3/DDP and A2780/DDP) were divided into the pre-NC, miR-29c-3p mimic, miR-29c-3p mimic + pcDNA, miR-29c-3p mimic + pcDNA-FOXP1, and miR-29c-3p mimic + pcDNA-FOXP1 + si-ATG14 groups. Cell viability was detected using the MTT assay, and protein levels of ATG4 and MDR-1 were detected using Western blot assay. Three independent experiments with biological repeats. *P < 0.05, vs. NC or pre-NC; #P < 0.05, vs. miR-29c-3p inhibitor + si-control or miR-29c-3p mimic + pcDNA; P < 0.05, vs. miR-29c-3p inhibitor + siRNA-FOXP1, or miR-29c-3p mimic + pcDNA-FOXP1
Figure 8. miR-29c-3p overexpression overcomes DDP resistance in vivo. Nude mice were subcutaneously injected with SKOV3/DDP cells, which were transfected with miR-29c-3p mimic (n = 5) or pre-NC (n = 5). DDP (4 mg/kg) was injected into nude mice every 3 days when the diameter of tumors reached 5 mm. (a) The sizes of the tumors were measured every 3 days. (b) After 21 d, the mice were killed, and the protein expression of FOXP1, ATG14, LC3-I, LC3-II, P62, Beclin 1, and MDR-1, and FOXP1 in nucleus was measured using Western blot assay. Three independent experiments with biological repeats of each mouse. *P < 0.05, vs. pre-NC