Figures & data
Table 1. Immunohistochemical data for marker expression in human MB*
Figure 1. Immunohistochemical analysis of human cerebellum and medulloblastomas. (a) Examples of immunoperoxidase staining patterns seen on archival paraffin sections from normal cerebellum and medulloblastomas, stained by antibodies to CD133, CD15 and VEGFR2 markers, respectively, as indicated. Scale bars: 30 μm; (b) Examples of immunoperoxidase staining patterns seen with antibodies against the general DNA damage response marker γH2AX, and the HCMV IE72 and HCMV late antigen, respectively. The bottom-row images show enlarged areas chosen from the lower-magnification images presented in the top row. Note the localization of the HCMV late antigen in endothelium of a blood vessel (with erythrocytes in the lumen). Scale bars: 20 ◽m
Figure 2. Morphology, selected markers and responses to ionizing radiation in the human medulloblastoma cell lines. (a) Top row: phase contrast microscopy images of exponentially growing DAOY, D324 and D283 cell lines; note the characteristic non-adherent, sphere-like growth pattern of the D283 cells, distinct from the flat morphology of the other cell lines. 2nd–4th row: examples of immunoperoxidase staining patterns for the stem-cell marker CD133, overall endogenous DNA damage (γH2AX) and the p53 tumor suppressor, as indicated, in the three MB cell lines grown under unperturbed conditions; Scale bar: 50 μm; (b) Immunoblot analysis of DNA damage markers in un-irradiated versus irradiated (one hour post 3Gy) MB cell lines and control BJ fibroblasts; note the high level of γH2AX in the D283 cells already before irradiation, and the distinct low RPA ser33 phosphorylation; the less apparent Chk1 and RPA response of BJ cells reflects mainly the lower S-phase dependent protein abundance of Chk1 and RPA, rather than aberrant responses. The DCS270 antibody used to detect total Chk2 levels is known to recognize the activated, T68-phosphorylated Chk2 less efficiently than unphosphorylated Chk2, hence the apparently weaker signals after IR, despite Chk2 levels do not fluctuate throughout the cell cycle [Citation37]
![Figure 2. Morphology, selected markers and responses to ionizing radiation in the human medulloblastoma cell lines. (a) Top row: phase contrast microscopy images of exponentially growing DAOY, D324 and D283 cell lines; note the characteristic non-adherent, sphere-like growth pattern of the D283 cells, distinct from the flat morphology of the other cell lines. 2nd–4th row: examples of immunoperoxidase staining patterns for the stem-cell marker CD133, overall endogenous DNA damage (γH2AX) and the p53 tumor suppressor, as indicated, in the three MB cell lines grown under unperturbed conditions; Scale bar: 50 μm; (b) Immunoblot analysis of DNA damage markers in un-irradiated versus irradiated (one hour post 3Gy) MB cell lines and control BJ fibroblasts; note the high level of γH2AX in the D283 cells already before irradiation, and the distinct low RPA ser33 phosphorylation; the less apparent Chk1 and RPA response of BJ cells reflects mainly the lower S-phase dependent protein abundance of Chk1 and RPA, rather than aberrant responses. The DCS270 antibody used to detect total Chk2 levels is known to recognize the activated, T68-phosphorylated Chk2 less efficiently than unphosphorylated Chk2, hence the apparently weaker signals after IR, despite Chk2 levels do not fluctuate throughout the cell cycle [Citation37]](/cms/asset/7cfda865-a5a9-445d-ac12-e55c7a324667/kccy_a_1728025_f0002_oc.jpg)
Figure 3. Flow cytometry profiles and HCMV IE72 expression in MB cell lines and BJ cells. (a) Cell cycle profiles of DAOY (left) and D283 (right) medulloblastoma cell lines. DAOY and D283 cells were infected with VR1814 HCMV (MOI 3) and their cell cycle profiles were analyzed by flow cytometry after propidium iodide staining at 24 and 96 hpi. Additionally, the expression of IE72 was assessed in both cell lines by two-parameter flow cytometry. NI – non-infected. (b–d) Medulloblastoma cell lines DAOY (b) and D283 (c) and normal BJ fibroblasts (d) were infected with VR1814 HCMV (MOI 3) and analyzed for expression of IE72 by fluorescence microscopy at 24 and 96 hpi. Graphs show the mean percentage of IE72-positive cells ± s.d.; NI – non-infected
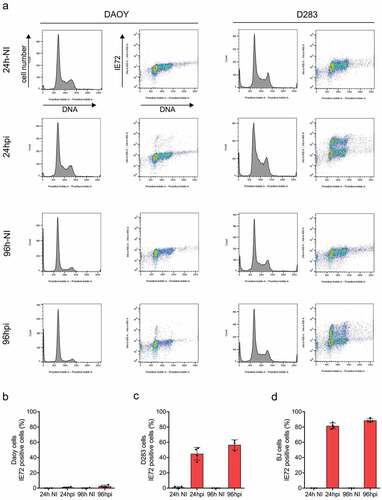
Figure 4. MBSC-like D283 cells show aberrant response to drug-induced replication stress. (a) Immunoblot analysis of the indicated DNA damage markers in the indicated three MB cell lines, under non-treated (NT), irradiated (one hour post 3Gy) and Hydroxyurea treated (HU) cells; Note the more robust Kap1 phosphorylation after irradiation in DAOY and D324 cells compared to the stem-like D283 cells, and particularly the hyperactive RPA Ser4/8 phosphorylation response to hydroxyurea (2 h, 2 mM) treatment in the D283 cells; NT – not treated. (b) Examples of immunoperoxidase staining patterns of RPA Ser4/8 phosphorylation in untreated and hydroxyurea treated D283 cells; Scale bar: 50 ◽m
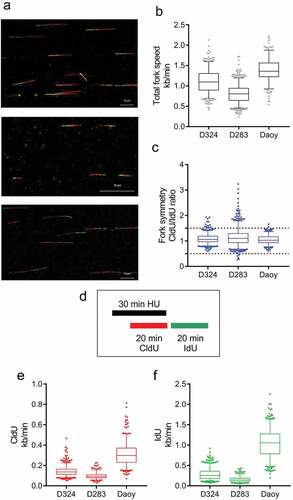
Figure 5. DNA fiber analysis in MB cell lines reveals high replication stress in D283. (a) Representative images of double-labeled DNA fibers. Medulloblastoma cell lines D324 (top), D283 (middle) and DAOY (bottom) were pulse-labeled with CldU (red) for 20 min, washed and pulse-labeled with IdU (green) for subsequent 20 min. Nucleosides were detected with antibodies and fiber length measured. (b) The length of CldU-IdU pulses from (a) was converted into kb/min. The graph shows total fork speed. Mean fork speed D324 = 1.1 kb/min, scored forks n = 479; D283 = 0.8 kb/min, n = 650; DAOY = 1.38 kb/min, n = 262. (c) The ratio between CldU/IdU was analyzed and plotted as relative frequencies. Values >1.5 and <0.5 indicate highly asymmetric forks. (D) The diagram of experimental settings for (e, f) is shown. (e) Induction of fork arrest by hydroxyurea (HU) treatment (2 mM, 30 min) in medulloblastoma cell lines (CldU mean fork speed D324 = 0.14 kb/min, scored forks n = 523; D283 = 0.09 kb/min, n = 258; Daoy = 0.31 kb/min, n = 363). (f) Fork recovery after HU treatment in medulloblastoma cell lines. CldU and HU were washed, and cells were incubated for 20 min in the fresh medium containing IdU (IdU mean fork speed D324 = 0.28 kb/min; D283 = 0.16 kb/min; DAOY = 1.0 kb/min). Whiskers in box plots indicate the 5–95th percentiles and the center values depict the median. Scale bars, 10 μm