Figures & data
Figure 1. Bioinformatics analysis of EZH2 and PBRM1 in cancer. The expression of EZH2 in kidney renal clear cell carcinoma (KIRC), brain lower-grade glioma (LGG), and liver hepatocellular carcinoma (LIHC) are significantly higher than those of normal tissues. T means tumor tissue and N means normal adjacent tissue. (b) EZH2 expression in different stages of KIRC. (c–e) The overall survival of patients with KIRC, LGG, and LIHC in reference to EZH2 expression. (f) The overall mutation rates of PBRM1, ARID1A, ARID1B, or SMARCA4 in KIRC, LGG, and LIHC
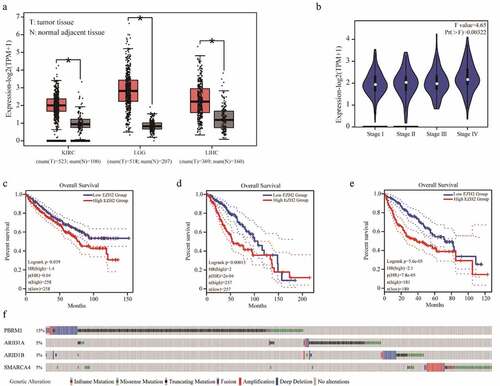
Table 1. Structures and docking scores of representative putative EZH2 inhibitors
Figure 2. Compounds screening in reference to GSK126-EZH2 interaction. (a, b) The binding mode of GSK126 to EZH2. (c) The purple spheres indicate the docking sites for virtual screening. Orange cube indicates the location and size of the grid to be calculated. Salmon spheres indicate the surface of amino acids 500–700 region. (d) The five putative EZH2 inhibitors were successfully docked into the defined binding pocket
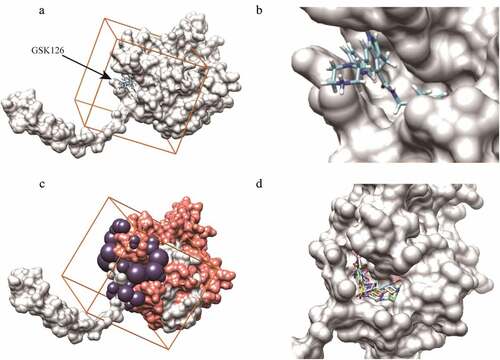
Figure 3. Interactions between EZH2 and the five candidate inhibitors. (a) Binding of C769-0015. (b) Binding of E218-0093. (c) Binding of L309-0080. (d) Binding of L501-1669. (e)Binding of M022-1782. (f) Binding of GSK126. Five candidate inhibitors are displayed as mesh surfaces in greed. Hydrogen bonds are indicated by broken red lines. The amino acid residues of EZH2 involved in hydrogen bonding and hydrophobic interaction are presented as stick models. The black arrows highlight the key residues involved in hydrogen bonding, other amino acids are involved in hydrophobic interactions
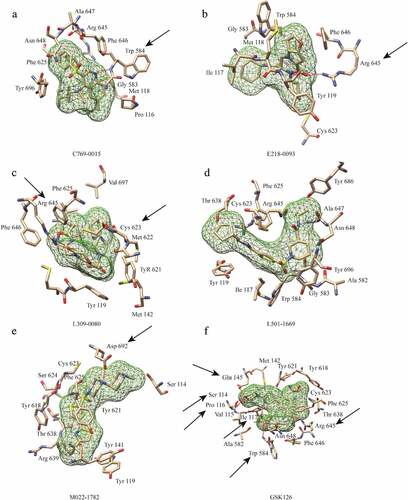
Figure 4. RMSD and RMSF analysis of EZH2-ligand complexes. (a) Backbone RMSD values (with respect to the X-ray structure) for EZH2-ligand complexes during 15 ns MD simulations. (b) Difference between the maximum and minimum fluctuation value of five putative inhibitors. (c) RMSFs of EZH2 in complex with five candidate inhibitors and GSK126 during the simulation. (d-i) The RMSF value of the amino acid that interacts with the inhibitors
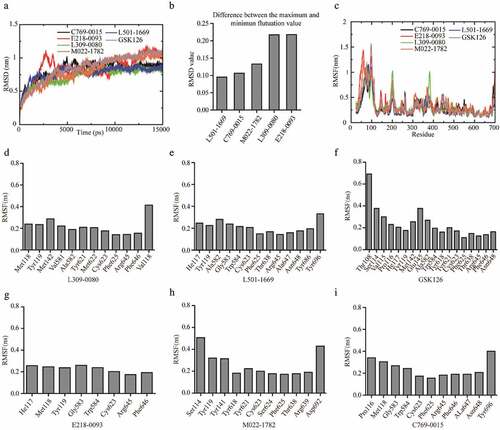
Figure 5. A704 and Caki-1demonstrated different sensitivities to EZH2-inhibition. (a) siRNAs transfection of Caki-1 and A704. The relative survival of transfected cell lines was accessed 72 h after transfection. Error bars represent the SDs (n = 3, *P < 0.05; **P < 0.01; ***P < 0.001). (b) EZH2 expression of cell lines after siEZH2s transfection (c) GSK126 treatment of Caki-1 and A704. (d) Clonogenic assay of cell lines with GSK126 treatment. Images of representative experiments were shown. Colonies were counted using image J software. (e) Quantification of clonogenic assay. The values were expressed in percentage relative to non-treated. Error bars represent the SDs (n = 3, *P < 0.05; **P < 0.01; ***P < 0.001)
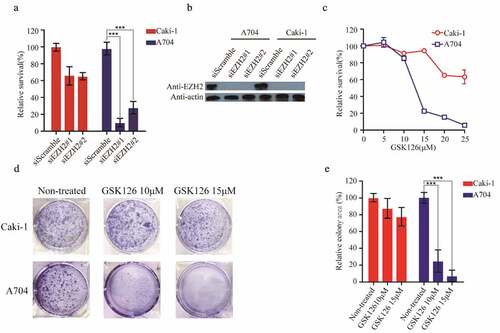
Figure 6. Validation of putative EZH2 inhibitors with Caki-1 and A704 cell lines. Caki-1 and A704 cell lines were treated with indicated concentration of five compounds ((a) C769-0015 (b) E218-0093 (c) M022-1782 (d) L309-0080 (e) L501-1669) for 72 h and evaluated for survival. The IC50 values of Caki-1 and A704 after L501-1669 treatment were 58.18μM and 35.42μM, respectively. (f) The dose–response curve of the data in e. (g) Clonogenic assay of cell lines with L501-1669 treatment. Images of representative experiments were shown. Colonies were counted using image J software. (h) Quantification of clonogenic assay. The values were expressed in percentage relative to non-treated. Error bars represent the SDs (n = 3, *P < 0.05; **P < 0.01; ***P < 0.001)
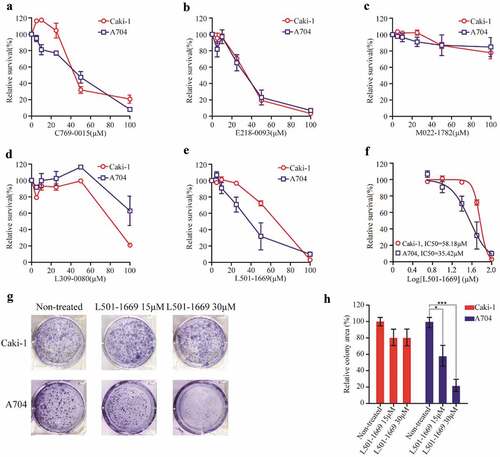
Figure 7. Evaluation of L501-1669 efficacy in PBRM1 knockdown cell line. (a, b), (a) Confirmation of PBRM1 knockdown in Caki-1 by western blotting. (b) Cell lines were treated by indicated concentration GSK126 and evaluated for cell survival after 5 d. (c) Cell lines were treated by indicated concentration L501-1669 and evaluated for cell survival after 5 d. (d) Clonogenic assay of cell lines with L501-1669 treatment. Images of representative experiments were shown. Colonies were counted using image J software. (e) Quantification of clonogenic assay. The values were expressed in percentage relative to non-treated. Error bars represent the SDs (n = 3, *P < 0.05; **P < 0.01; ***P < 0.001)
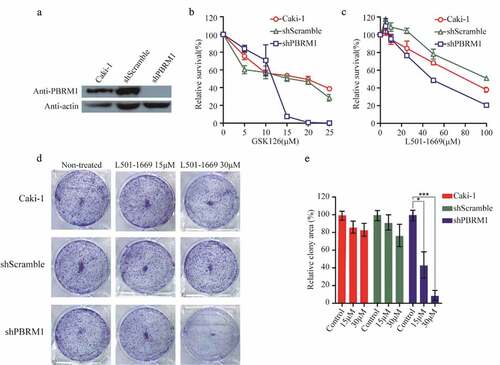
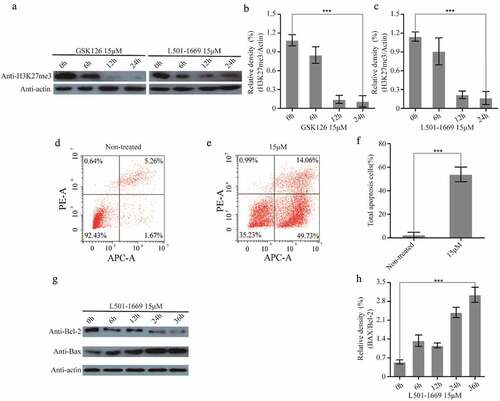
Figure 8. L501-1669 inhibited EZH2 methyltransferase activity and induced apoptosis. (a) H3K27me3 expression after different time points of GSK126 and L501-1669 treatment. (b, c) Relative density in a. The values were normalized against the non-treated sample. Error bars represent the SDs (n = 3, *P < 0.05; **P < 0.01; ***P < 0.001). (d, e) Cell apoptosis of A704 after different treatments. (f) Quantification of d and e. The values were the percentage of apoptosis cells. Error bars represent the SDs (n = 3, *P < 0.05; **P < 0.01; ***P < 0.001). (g) Bcl-2 and Bax expression after L501-1669 treatment. (h) Relative density in g. The values were normalized against the non-treated sample. Error bars represent the SDs (n = 3, *P < 0.05; **P < 0.01; ***P < 0.001)