Figures & data
Table 1. Correlation between the clinicopathologic variables and hsa_circ_0091581 expression in HCC tissues
Figure 1. Hsa_circ_0091581 expression was upregulated in HCC tissues and correlated with prognosis of HCC patients. (a) Heatmap showing the circRNA expression profiles of HCC tissues and ANTs. Red and green indicate high and low expression, respectively. (b) Relative expression of hsa_circ_0091581 in 46 pairs of HCC tissues and ANTs was detected using qRT-PCR. (c) Relative expression of hsa_circ_0091581 in four human HCC cell lines and one human normal hepatic cell line was detected using qRT-PCR. The data were analyzed using the delta Ct method and presented as mean ± SD. ***P < 0.001. (d) Disease-free survival of patients with high-level hsa_circ_0091581 expression and low-level hsa_circ_0091581 expression; P = 0.004. (e) Overall survival of patients with high-level hsa_circ_0091581 expression and low-level hsa_circ_0091581 expression; P < 0.001. Hsa_circ_0091581 expression low/high: the expression of hsa_circ_0091581 in HCC tissues was lower/higher than the median
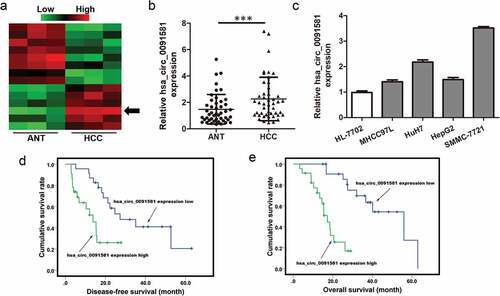
Figure 2. Downregulation of hsa_circ_0091581 inhibited the proliferation of HCC cells. (a, b) Relative hsa_circ_0091581 and GPC3 mRNA expression in SMMC-7721 cells transfected with hsa_circ_0091581 siRNA. (c, d) CCK8 and colony formation proliferation assays of SMMC-7721 cells transfected with hsa_circ_0091581 siRNA. Results are presented as mean ± SD. NS, not significant, *P < 0.05, **P < 0.01
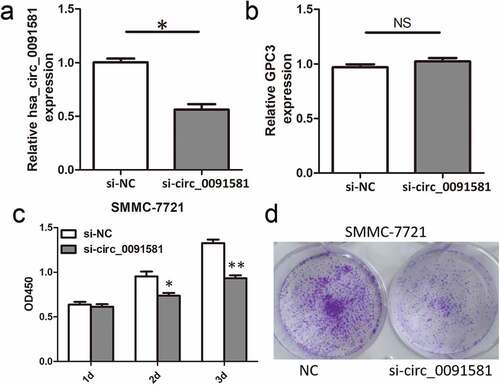
Figure 3. Hsa_circ_0091581 could act as a sponge of miR-526b in HCC cells. (a) Predicted miR-526b binding site and corresponding mutant sites in the hsa_circ_0091581 sequence (wt, wild-type; mut, mutant). (b) Relative luciferase activity in SMMC-7721 cells co-transfected with wt or mut luciferase reporters and miR-526b mimics or corresponding negative control. (c) Relative miR-526b expression in SMMC-7721 cells transfected with hsa_circ_0091581 siRNA. (d) Relative miR-526b expression in 46 pairs of HCC tissues and ANTs was detected using qRT-PCR. (e) Correlation between relative hsa_circ_0091581 expression and relative miR-526b expression analyzed with Spearman’s analysis. (g, f) CCK8 and colony formation proliferation assays of SMMC-7721 cells co-transfected with hsa_circ_0091581 siRNA and miR-526b inhibitor or corresponding negative controls. Results are presented as mean ± SD. *P < 0.05, **P < 0.01, ***P < 0.001
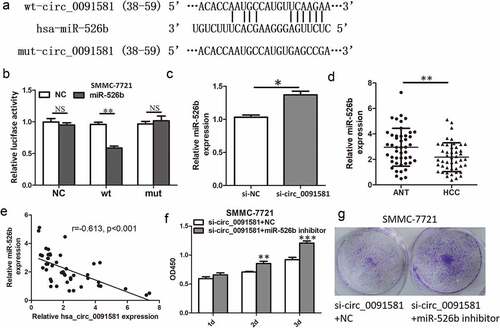
Figure 4. C-Myc was a target of miR-526b and could upregulate hsa_circ_0091581 expression in HCC. (a) Predicted miR-526b binding site and corresponding mutant sites in the c-Myc 3ʹUTR (wt, wild-type; mut, mutant). (b) Relative luciferase activity in SMMC-7721 cells co-transfected with wt or mut luciferase reporters and miR-526b mimics or corresponding negative control. (c) Relative c-Myc protein level in SMMC-7721 cells transfected with miR-526b mimics. (d) Relative c-Myc protein level in SMMC-7721 cells co-transfected with hsa_circ_0091581 siRNA and miR-526b inhibitor or corresponding negative controls. (e, f) Relative hsa_circ_0091581 expression in SMMC-7721 cells transfected with c-Myc overexpression plasmids or siRNA. (g) Correlation between relative hsa_circ_0091581 expression and relative c-Myc mRNA expression analyzed with Spearman’s analysis. Results are presented as mean ± SD. *P < 0.05, **P < 0.01
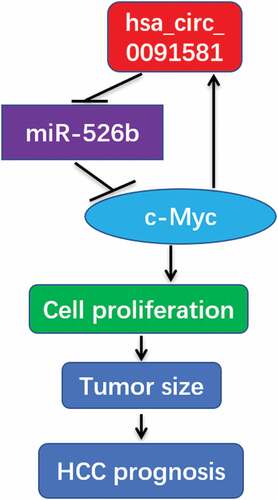
Figure 5. Diagram showing roles of hsa_circ_0091581/miR-526b/c-Myc/hsa_circ_0091581 positive feedback loop in HCC