
Figures & data
Figure 1. HOXA2 expression in glioma. Association with expression and clinicopathologic characteristics, including a: Age, b: Grade, c: PRS_type, d: 1p19q_codeletion status, e: IDH mutation status f: Histology.
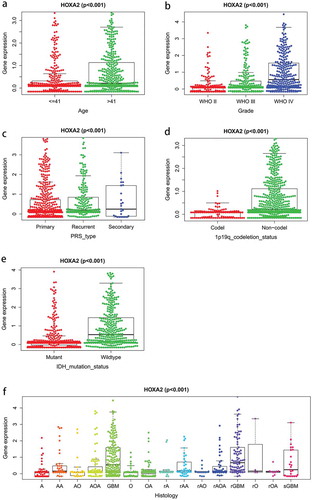
Figure 2. The Kaplan-Meier survival curve and The ROC curve. a: High expression of HOXA2 leads to poor overall survival in glioma patients. b: The ROC curve show good diagnosis value of HOXA2 expression in glioma.
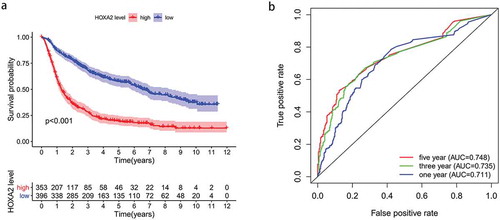
Figure 3. Univariate regression of prognostic in patients with glioma.
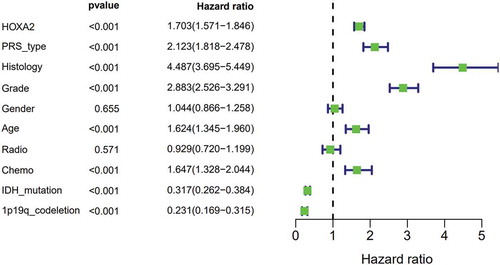
Figure 4. Multivariate survival model of prognostic in patients with glioma.
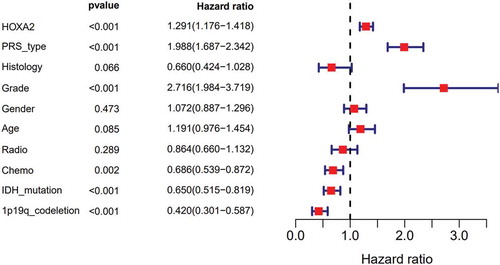
Table 1. The gene set enriches the high HOXA2 expression phenotype.
Figure 5. Enrichment plots from GSEA. a:JAK-STAT-signaling pathway; b:focal adhesion; c:cell-adhesion-molecules-CAMS pathway; d:cytosolic DNA sensing pathway; e:natural killer cell-mediated cytotoxicity.
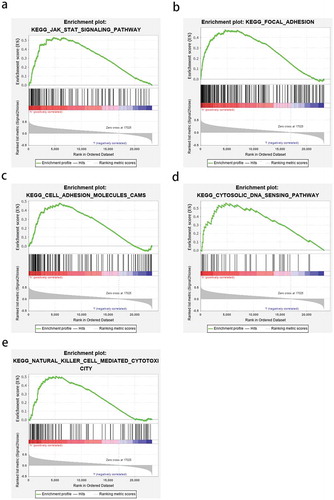
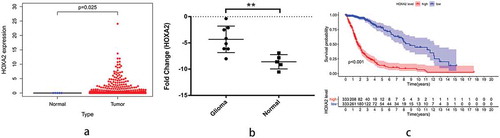
Figure 6. TGCA database verification survival analysis and RT-qPCR verification results.a: The diff figure showed that the HOXA2 expression increased significantly in glioma; b: The Kaplan-Meier curve based on TCGA database show that high expression of HOXA2 can lead to poor prognosis in patients with glioma. c: The results of PCR verification showed that HOXA2 was highly expressed in glioma patients.
Supplemental Material
Download MS Word (16.6 KB)Data availability statement
The authors confirm that the data supporting the findings of this study are available within the article.