Figures & data
Table 1. Sev ameliorates cardiac dysfunction induced by myocardial IRI at T0 and T4.
Figure 1. Sev ameliorates cardiac dysfunction. a, myocardial tissues of mice in each group examined by HE staining. b, effects of Sev pretreatment on the MI size of mice in each group determined by TTC staining. c, cardiomyocyte apoptosis of mice in each group examined by TUNEL staining. Each group includes 8 mice and each spot represents for a single mouse. One-way ANOVA and Tukey’s multiple comparison test were used to determine statistical significance, *p < 0.05.
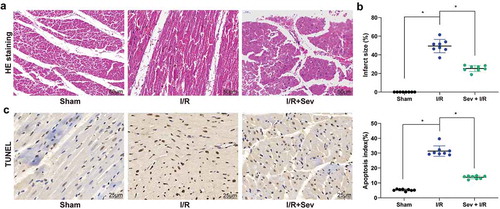
Figure 2. miR-219a is elevated in Sev-treated I/R mice. a, the heatmap of differentially expressed miRNAs. b, miR-219a expression among sham-, I/R- and I/R + Sev-treated mice determined by RT-qPCR. Then, miR-219a atagomiR and its negative control atagomiR Mock was injected into myocardial tissues. c, miR-219a expression determined by RT-qPCR. Each group includes 8 mice and each spot represents for a single mouse. One-way ANOVA and Tukey’s multiple comparison test or unpaired t test were used to determine statistical significance, *p < 0.05.
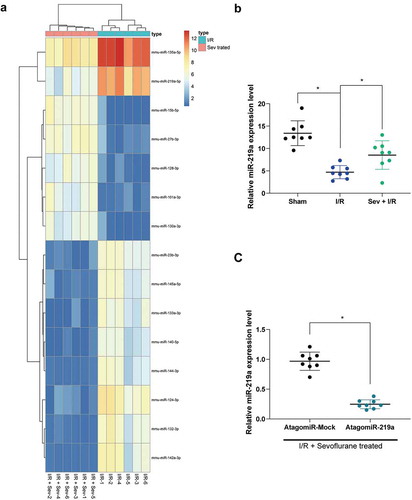
Table 2. MiR-219a silencing atagomiR blocks the protective role of Sev on cardiac dysfunction.
Figure 3. MiR-219a atagomiR blocks the preventive effect of Sev on cardiac dysfunction. a, myocardial tissues of mice in each group examined by HE staining. b, effects of Sev treatment on the infarction size of mice determined by TTC staining. c, cardiomyocyte apoptosis of mice in each group examined by TUNEL staining. Each group includes 8 mice and each spot represents for a single mouse. Unpaired t test was used to determine statistical significance, *p < 0.05.
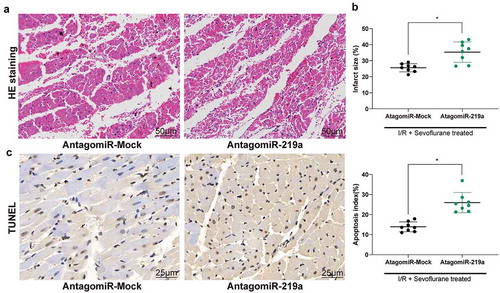
Figure 4. miR-219a inhibits the activation of the TLR4/MYD88 pathway by targeting AIM2. a, AIM2 mRNA, and miR-219a combination determined by dual-luciferase assays. b, AIM2 mRNA expression determined by RT-qPCR. c, AIM2 protein expression determined by western blot. d, TLR4 and MYD88 protein expression in mice determined by western blot. Each group includes 8 mice and each spot represents for a single mouse. Unpaired t test was used to determine statistical significance, *p< 0.05.
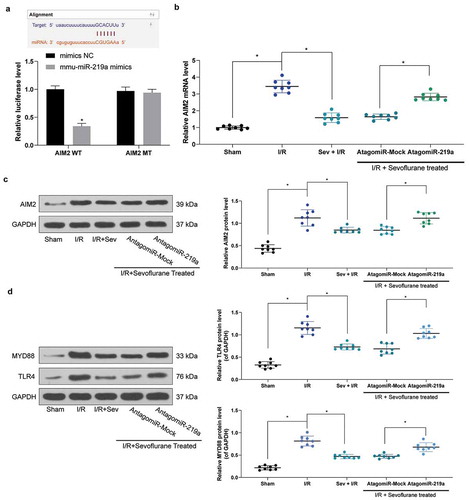
Table 3. TLR4 agonist LPS treatment blocks the protection of Sev on cardiac dysfunction.
Figure 5. TLR4 agonist LPS treatment blocks the effective role of Sev on cardiac dysfunction. a, TLR4 and MYD88 protein expression in mice was determined by western blot. b, myocardial tissues of mice in each group examined by HE staining. c, effects of Sev pretreatment on the MI size of mice in each group determined by TTC staining. d, cardiomyocyte apoptosis of mice in each group examined by TUNEL staining. Each group includes 8 mice and each spot represents for a single mouse. Unpaired t test was used to determine statistical significance, *p < 0.05.
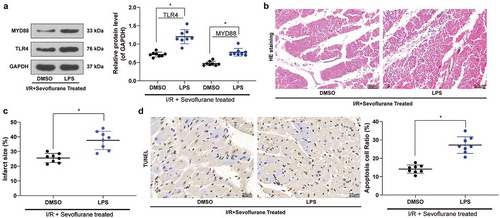
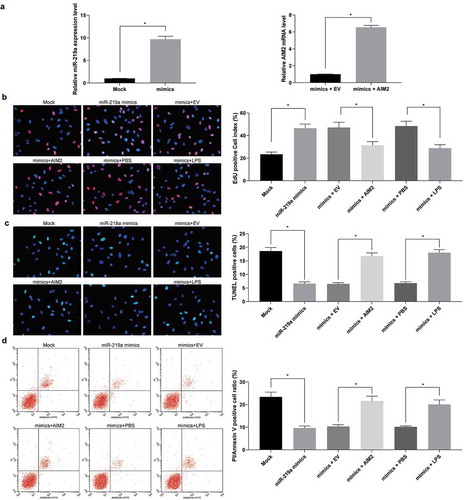
Figure 6. Upregulation of miR-219a induces cardiomyocyte viability. a. miR-219a expression and the mRNA expression of AIM2 in cardiomyocytes determined by RT-qPCR. b, EdU staining of cardiomyocyte viability. c, TUNEL staining of cardiomyocyte apoptosis. d, cardiomyocyte apoptosis index evaluated by PI/Annexin V with flow cytometry. The data are displayed as the mean ± SD. One-way ANOVA and Tukey’s multiple comparison test were applied to determine statistical significance, *p < 0.05.