
Figures & data
Figure 1. Dynamics of endogenous RCC1 on mitotic chromatin. (a) Western blotting with anti-RCC1 antibodies of parental HCT116 cells (left lane) and in cells in which endogenous RCC1 is tagged with iRFP670-P2A-TIR1 (second lane). Note the RCC1 mobility shift after insertion. Actin is shown as a loading control (lower panel). (b, c) Fluorescence Recovery after Photobleaching (FRAP) analysis of RCC1 in HCT116RCC1-iRFP670 cells during metaphase (b) or anaphase B/telophase (c). White square indicates the position of analyzed region. Red square indicates the region used for estimation of Fmax (see Materials and Methods). Results are expressed as an average from a total of 12 measurements recorded from 3–4 independent experiments. Note that RCC1 is highly mobile during metaphase.
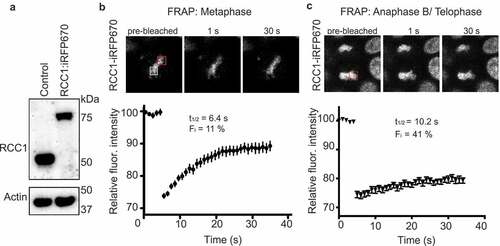
Figure 2. Over-expression of RanBP1 increases RCC1 dynamics on chromatin during metaphase. (a) Western blotting with anti-RanBP1 antibodies of parental HCT116 cells (left lane) and cells in which RanBP1 is over-expressed by using endogenous alpha-tubulin promoter (tub>RanBP1, right lane). Ran is shown as a loading control (lower panel). (b) FRAP analysis of cells overexpressing RanBP1 (red). The graph representing dynamics of RCC1 in parental cells (black) is the same as shown in ). (c) Fluorescence Loss in Photobleaching (FLIP) analysis of cells, as in (B). White dash line outlines the mitotic cell, white square indicates the bleached region and white circle indicates the ROI. Yellow square denotes the position of control ROI in neighboring interphase cell, used for measuring nonspecific loss of fluorescence during experiment (Fc). Results are expressed as an average ± SEM from a total of 12 measurements recorded from 3–4 independent experiments. p < 0.001 (F test).
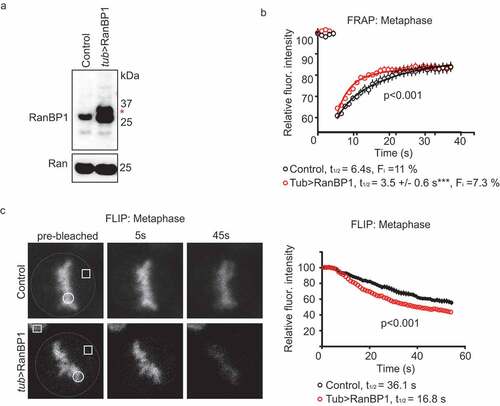
Figure 3. Depletion of RanBP1 using an Auxin-induced degron (AID) system. (a) A schematic diagram illustrating AID system. (b) Western blotting with anti-RanBP1 antibodies of parental HCT116 (control, left lane) and HCT116RanBP1-μAID/HA cells that were incubated without (middle lane) or with (right lane) 1 mM Auxin for 3 h. Note efficient degradation of RanBP1-µAID-HA upon Auxin addition. Actin is shown as a loading control (lower panel). (c) Images of DLD1RanBP1-Neon/3mAID/FLAG cells, in which both endogenous RanBP1 and RCC1 are tagged (RanBP1 is tagged with fluorescent protein (Neon), three copies of a minimal AID (3 x mini-AID) and a FLAG tag (RanBP1-Neon-3mAID-FLAG) and RCC1 is tagged with infrared fluorescent protein: RCC1-iRFP670::TIR1). Cells are shown before (left column) and after (right column) addition of 1 mM Auxin for 3 h. Note localization of RanBP1 to mitotic spindle. Scale bars = 10 μm.
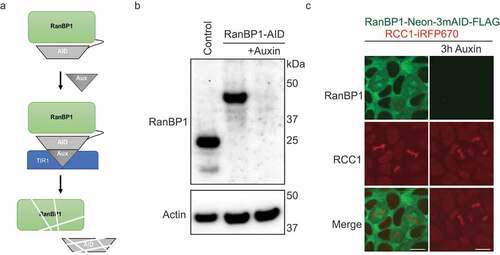
Figure 4. RanBP1 is dispensable for cell growth and nucleo-cytoplasmic transport of a model substrate. (a) Crystal violet assay of HCT116RanBP1-μAID/HA and parental HCT116 cells grown with or without Auxin (1 mM) for 4 d. Quantification of the number of cells are shown on the right. (b) Left: HCT116RanBP1-μAID/HA cells, expressing a model NLS-NES-containing substrate (NLS-mCherry-LEXY). In this system, exposure of cells to UV light induces nuclear export, while switching off light induces nuclear import. White circle indicates the region of fluorescent intensity measurements. Right: Quantification of nucleocytoplasmic transport in HCT116RanBP1-μAID/HA cells without (n = 6) and with 1 mM Auxin (n = 4). Note similar dynamics of both nuclear import and export in cells with or without RanBP1. N.s., non-significant (t-test).
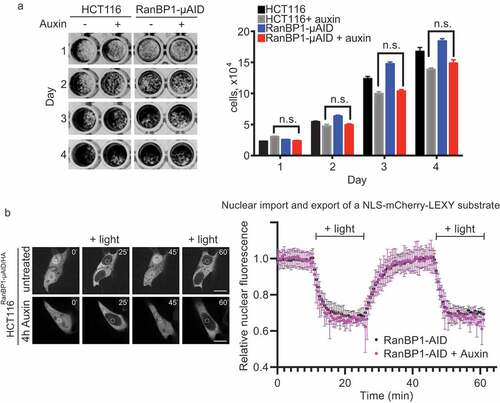
Figure 5. Depletion of RanBP1 decreases RCC1 dynamics. (a) FRAP analysis of RCC1 dynamics on metaphase chromatin in HCT116RanBP1-μAID/HA cells expressing RCC1-iRFP670::TIR1 and RanBP1-µAID-HA treated with (blue) or without (black) 1 mM Auxin for 3 h. (b) FLIP analysis cells, as in (A). (c) FRAP analysis of RCC1 dynamics on chromatin during anaphase B/telophase. Results are expressed as an average from a total of 12 measurements recorded from 3 independent experiments. (significance was assessed by F test). (d) RanBP1 was immunoprecipitated from mitotic lysates of control or Auxin-treated HCT116RanBP1-μAID/HA cells that express RanBP1-µAID-HA and RCC1-iRFP670 using HA antibody. Proteins were separated by SDS-PAGE and analyzed by immunoblotting with antibodies against RCC1, RanBP1, Ran, HA and RanBP3. Total lysate of parental HCT116 cells is shown in the first lane, for comparison purposes. Note both efficient interaction of RCC1 and RanBP1 (lane 4) and its specificity (lane 5).
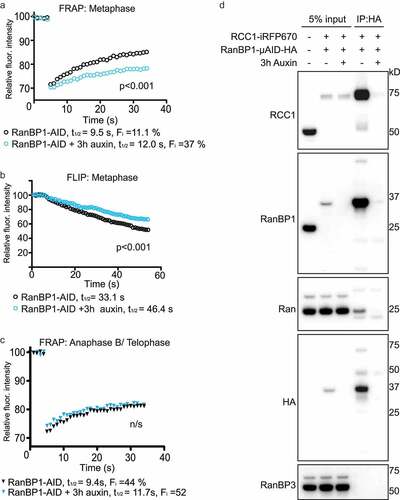
Figure 6. RanBP1 regulates mitotic progression. In all results shown in panels A-F, 1 mM Auxin was added where indicated for 4 h before recording of the cells. (a) Timing of mitotic progression (NEBD to anaphase) of HCT116RanBP1-μAID/HA cells without (t = 33.48 ± 7.31 mins, n = 40) and with Auxin (t = 40.35 ± 15.10 mins, n = 40). (b) Timing of NEBD-to-metaphase without Auxin (16.65 ± 5.08 mins, n = 40) and with Auxin (14.33 ± 3.43 mins, n = 40). (c) Timing of metaphase-to-anaphase transition without (16.83 ± 5.99 mins, n = 40) and with Auxin (26.03 ± 14.98 mins, n = 40). (d) Quantification of percentage of lagging chromosomes in anaphases without (12.50 ± 3.42%, n = 40) and with Auxin (23.0 ± 5.60%, n = 40). (e) Images of HCT116RanBP1-μAID/HA cells before and after addition of Auxin. Note chromosome misalignments during metaphase and lagging chromosomes during anaphase after depletion of RanBP1. Scale bars = 10 μm. (f) Timing of NEBD-to-anaphase progression of control (HCT116) (t = 32.27 ± 6.90 mins, n = 41) and HCT116Tub>RanBP1 cells (t = 28.24 ± 5.32 mins, n = 41). (g) Timing of NEBD-to-metaphase of control (t = 14.10 ± 2.37 mins, n = 41) and HCT116Tub>RanBP1 cells (t = 11.49 ± 2.50 mins, n = 41). (h) Timing metaphase-to-anaphase of control (t = 18.15 ± 6.71 mins, n = 41) and HCT116Tub>RanBP1 cells (t = 16.76 ± 5.20 mins, n = 41). (i) Quantification of percentage of lagging chromosomes in anaphases of control (10.75 ± 2.99%, n = 41) and HCT116Tub>RanBP1 cells (10.00 ± 4.08%, n = 41). Bars indicate mean ± SD from more than 3 independent experiments. N.s., non-significant; * p < 0.05; ** p < 0.01; *** p < 0.001 (Mann–Whitney t test).
Figure 7. RanBP1 regulates mitotic HURP localization. (a) Immuno-staining with HURP and Tubulin antibodies in HCT116RCC1-µAID−3xFLAG, HCT116RanGAP1−3mAID and HCT116RanBP1-µAID-HA cells treated with or without 1 mM Auxin for 5, 2 and 3 h, respectively. White dashed lines represent the length of HURP signal (top row). Bottom: graphical representations of the expected distribution of the RanGTP gradient under indicated conditions. (b) Quantification of HURP signal normalized by Tubulin staining on the spindle in (A). Bars indicate mean ± SD from a total of 10 cells in more than 3 independent experiments. *** (p < 0.001, t-test). Scale bars = 10 μm.
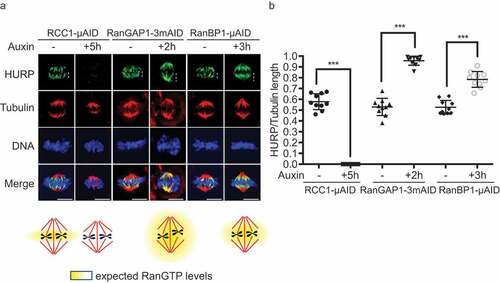
Figure 8. Graphic overview of how RanBP1 regulates mitotic HURP localization. RCC1 retains the ability to interact with chromosome in mitosis after nuclear envelope breakdown, catalyzing conversion of Ran-GDP to Ran-GTP near chromosomes. Interaction of RCC1 with chromosomes is dynamic, and cytosolic RCC1 is trapped into inactive RanBP1-Ran-RCC1 complex (RRR), which is also dynamic. Thus, RanBP1 concentrations control the amount of RCC1 on chromosomes and RanGTP production. Proteins of Importin α/β family bind and inhibit SAFs, a class of proteins promoting nucleation, formation and stabilization of spindle microtubule [Citation38], at low Ran-GTP concentrations throughout much of the mitotic cell. Near chromosomes, RCC1 generates an elevated concentration of Ran-GTP, locally disrupting inhibitory complexes and allowing full SAF activity.
![Figure 8. Graphic overview of how RanBP1 regulates mitotic HURP localization. RCC1 retains the ability to interact with chromosome in mitosis after nuclear envelope breakdown, catalyzing conversion of Ran-GDP to Ran-GTP near chromosomes. Interaction of RCC1 with chromosomes is dynamic, and cytosolic RCC1 is trapped into inactive RanBP1-Ran-RCC1 complex (RRR), which is also dynamic. Thus, RanBP1 concentrations control the amount of RCC1 on chromosomes and RanGTP production. Proteins of Importin α/β family bind and inhibit SAFs, a class of proteins promoting nucleation, formation and stabilization of spindle microtubule [Citation38], at low Ran-GTP concentrations throughout much of the mitotic cell. Near chromosomes, RCC1 generates an elevated concentration of Ran-GTP, locally disrupting inhibitory complexes and allowing full SAF activity.](/cms/asset/16da57ba-53c0-4263-b20a-d9c77a13e260/kccy_a_1782036_f0008_oc.jpg)