Figures & data
Figure 1. Effects of metformin on proliferation, viability, and apoptosis of PANC-1 cells cultured in high and low glucose conditions.
Figure 2. Relative expression of miR-210-5p in PANC-1 cells treated with metformin in high and low glucose conditions.
Figure 3. Effects of miR-210-5p mimic and inhibitor on the viability of PANC-1 cells cultured in high and low glucose conditions.
Figure 4. Effects of miR-210-5p mimic combined with or without metformin on the expression of PFKFB2 and p-PFKFB2 in PANC-1 cells.
Figure 5. Effects of miR-210-5p mimic combined with or without metformin on glycolysis related enzyme and products in PANC-1 cells.
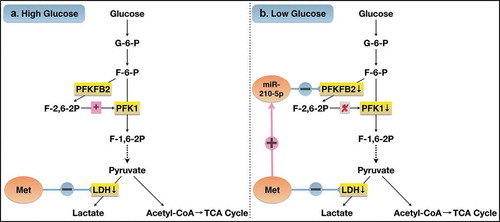
Figure 6. Possible mechanism of the difference in the effect of metformin on PANC-1 cells cultured in high and low glucose.