Figures & data
Figure 1. Analyses of breast cancer susceptibility in cyclin E-deficient mice. (a) Comparison of breast cancer incidence between control cyclin E1+/+E2+/+/MMTV-c-Myc (WT), cyclin E1-/-/MMTV-c-Myc and cyclin E2-/-/MMTV-c-Myc females. Mice were monitored by palpation for the presence of breast tumors. (b) A similar analysis using cyclin E1+/+E2+/+/MMTV-c-Myc (WT), cyclin E1-/-E2+/-/MMTV-c-Myc and cyclin E1+/-/E2-/-/MMTV-c-Myc females (the same input for WT mice was used to generate panels a and b). ANOVA test for multiple comparisons (Friedman test) was used for calculate the p-values. ***, p < 0.001; in panel (a) differences were not significant. (c and d) The estimated total tumor burden (per mouse) in tumor-bearing animals of the indicated genotypes. Each dot corresponds to a different mouse and represents the combined tumor volume (the same input for WT mice was used to generate both panels). Tumor volumes were calculated according to the formula V = a x b2/2 (a is tumor length and b is tumor width). Horizontal lines depict mean values. There were no significant differences between the groups (Kruskal-Wallis test with Dunnett’s multiple comparison test)
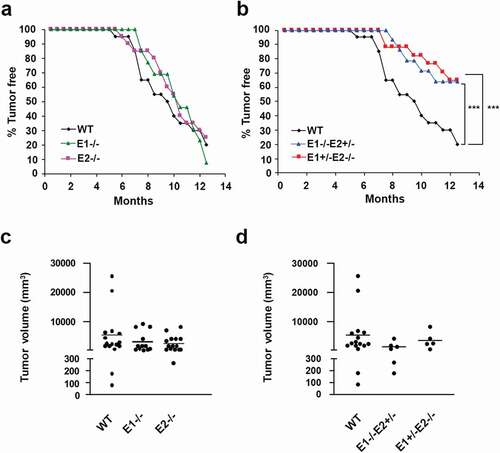
Figure 2. Cyclins E1 and E2 are required for proliferation of triple-negative breast cancer (TNBC) cell lines with high c-Myc expression. (a) Immunoblot analysis of c-Myc, cyclin E1, E2 and CDK2 levels in the indicated human breast cancer cell lines. HSP90 was used as a loading control. (b) Immunoblot analysis of cyclin E1 and E2 levels in the indicated six TNBC cell lines following transduction with viruses encoding anti-cyclin E1 and E2 shRNAs (E1+ E2-sh), or control shRNA (Con-sh). β-actin was used as a loading control. (c) The percentage of cells in the indicated phases of the cell cycle following depletion of E-cyclins as in panel b. Cells were pulsed with BrdU, stained with an anti-BrdU antibody and propidium iodide and analyzed by FACS. Shown are mean values, error bars indicate SD, n = 3. Unpaired two-tailed Student’s t test was used to evaluate the differences between S-phase fractions in Con-sh versus E1+ E2-sh groups. ***, p < 0.001. (d) Growth curves of the indicated human TNBC cell lines following depletion of E-cyclins as in panel b. Shown are relative numbers of cells on the indicated days; the number of plated cells (day 0) was set as 1. Error bars indicate SD, n = 3. Unpaired two-tailed Student’s t test was used for the statistical analysis of the differences between Con-sh versus E1+ E2-sh groups at the indicated time-points. *, p < 0.05; ***, p < 0.001. (e) The indicated TNBC cell lines were plated at 2.5 × 10⁴ cells per well in 12 well plates following depletion of cyclins E1 and E2, as in panel b. Cells were stained and photographed after 7 days. Scale bar, 2 cm
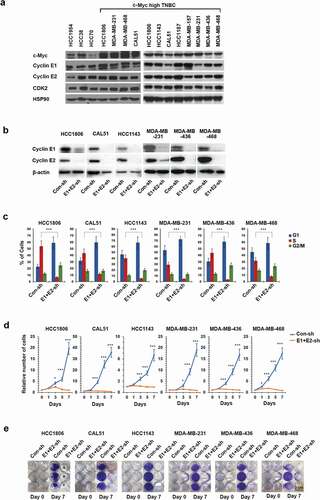
Figure 3. CDK2 is dispensable for proliferation of TNBC cell lines. (a) Immunoprecipitation (IP) using anti-CDK2 (left) or anti-CDK1 (right) antibodies, followed by immunoblotting with an anti-cyclin E1 antibody in CAL51 and HCC1806 cells. Note that immunoprecipitated CDK2 brought down large amounts of cyclin E1, and that essentially no cyclin E1 protein was left in the supernatants after CDK2 IP. In contrast, very little cyclin E1 was detected after CDK1 IP, and cyclin E1 remained in the supernatant. Whole cell extracts (WCE) were also immunoblotted. (b) Immunoblot analysis of CDK2 levels in the indicated human TNBC cell lines after CRISPR-mediated knockout of CDK2 (CDK2-sg), compared with cells transduced with control viruses (Lenti-con). Tubulin was used as a loading control. (c) Growth curves of the indicated human TNBC cell lines following knockout of CDK2 (CDK2-sg) compared with cells transduced with control viruses (Lenti-con). Shown are relative numbers of cells on the indicated days; the number of plated cells (day 0) was set as 1. Error bars indicate SD, n = 3. (d) The indicated TNBC cell lines were plated at 2.5 × 10⁴ cells per well in 12 well plates following knockout of CDK2, as in panel b. Cells were stained and photographed after 9 days. Scale bar, 2 cm
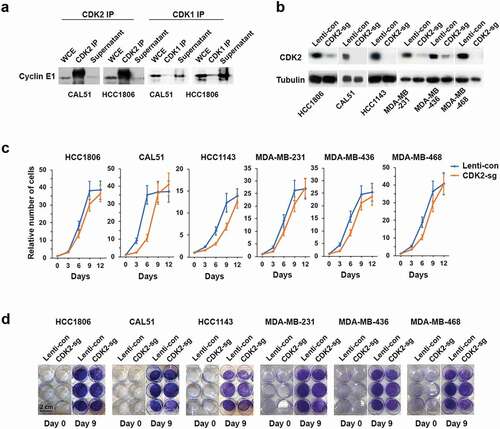
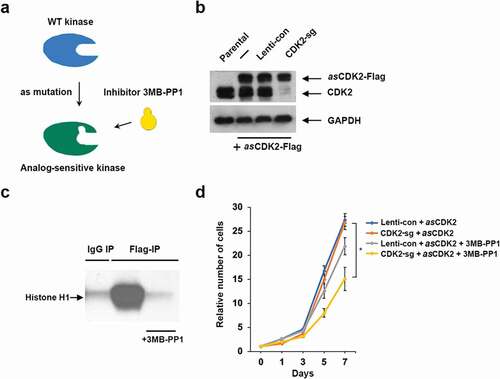
Figure 4. Analyses of TNBC cells expressing analog-sensitive CDK2. (a) A diagram illustrating the principle of analog-sensitive kinases. (b) Immunoblot analysis of the levels of ectopically expressed analog-sensitive CDK2 (asCDK2-Flag) and the endogenous CDK2 (CDK2) in parental HCC1806 cells (first lane) or cells expressing asCDK2 (lanes 2–4). In lane 3, cells were transduced with a control lentivirus (Lenti-con), in lane 4 cells underwent CRISPR-mediated knockout of CDK2 (CDK2-sg). GAPDH was used as loading control. (c) asCDK2 was immunoprecipitated from CDK2-knockout HCC1806 cells expressing asCDK2 using an anti-Flag antibody, and subjected to in vitro kinase reactions using histone H1 as a substrate in the presence or absence of 3MB-PP1. As a negative control, in vitro kinase reaction was performed using immunoprecipitates obtained with IgG (IgG IP). (d) Growth curves of HCC1806 cells transfected with a control lentivirus and expressing asCDK2 in addition to the endogenous CDK2 (Lenti-con + asCDK2), or CDK2 knockout cells expressing asCDK2 (CDK2-sg + asCDK2). Cells were cultured in the presence or absence of 10 μM 3MB-PP1 (+3MB-PP1). Shown are relative numbers of cells on the indicated days; the number of plated cells (day 0) was set as 1. Error bars indicate SD, n = 3. Unpaired two-tailed Student’s t test was used for the statistical analysis, comparing CDK2-sg + asCDK2 versus CDK2-sg + asCDK2 + 3MB-PP1; *, p < 0.05