
Figures & data
Figure 1. Propofol alleviates cell proliferation, migration, invasion and aerobic glycolysis in lung cancer in vitro. (a) Cell viability was detected using CCK-8 assay in A549 and H1299 cells treated with different concentrations of propofol (2, 4, 6, 8, and 10 µg/mL). (b) Cell viability was detected using CCK-8 assay in A549 and H1299 cells treated with 8 µg/mL propofol for 24, 48, and 72 h. A549 and H1299 cells were treated with 8 µg/mL propofol for 48 h. (c) Cell proliferation was analyzed using BrdU assay. (d,e) Cell migration and invasion were measured by transwell assay. (f,g) The glucose consumption and lactate production were determined by a glucose and lactate assay kit. (h) Extracellular acidification measurements were performed by Seahorse XF24 Extracellular Flux Analyzer. (i) Western blot was used to examine the protein expression of GLUT1, PKM2, HK2 and LDHA in A549 and H1299 cells. *P < 0.05.
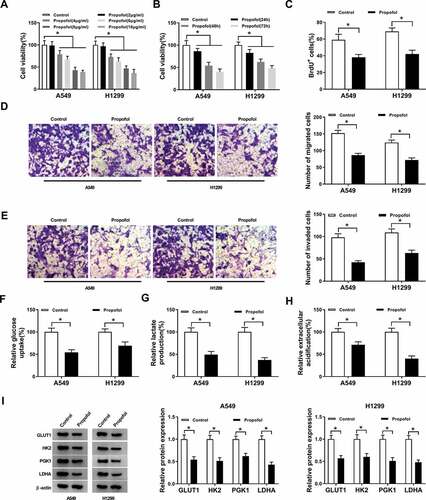
Figure 2. Propofol inhibits the expression of circTADA2A in lung cancer cell lines. (a,b) The expression of circTADA2A in lung cancer tumor tissues and normal tissues, as well as lung cancer cell lines and normal BEAS-2B cell line was measured using qRT-PCR. (c) The expression of circTADA2A in A549 and H1299 cells treated with or without propofol was detected by qRT-PCR. *P < 0.05.
Figure 3. Propofol mitigates cell tumorigenesis and aerobic glycolysis in lung cancer by regulating circTADA2A. A549 and H1299 cells were transfected with pcDNA-NC or pcDNA-circTADA2A prior to propofol exposure. (a) The transfection efficiency was determined using qRT-PCR. (b,c) Cell proliferation was analyzed using CCK-8 and BrdU assay. (d,e) Transwell assay was applied to detect cell migration and invasion. (f,g) The glucose consumption and lactate production were assessed using a glucose and lactate assay kit. (h) Extracellular acidification measurements were conducted by Seahorse XF24 Extracellular Flux Analyzer. (I. J) The levels of GLUT1, PKM2, HK2, and LDHA protein in A549 and H1299 cells were examined by western blot. *P < 0.05.
Figure 4. CircTADA2A is a sponge of miR-455-3p in lung cancer cells. (a) The potential binding sites between circTADA2A and miR-455-3p were predicted by StarBase3.0 program. (b,c) Luciferase activity of A549 and H1299 cells co-transfected with circTADA2A-WT or circTADA2A-MUT and miR-455-3p mimics or miR-NC was examined by dual-luciferase reporter assay. (d,e) qRT-PCR analysis of miR-455-3p expression in A549 and H1299 cells transfected with si-NC, si-circTADA2A, pcDNA-circTADA2A, or pcDNA-NC was conducted. (f,g) The expression of miR-455-3p in lung cancer tumor tissues and normal tissues, as well as lung cancer cell lines and normal BEAS-2B cell line was measured using qRT-PCR. (h) The level of miR-455-3p was examined using qRT-PCR in A549 and H1299 cells treated with propofol. *P < 0.05.
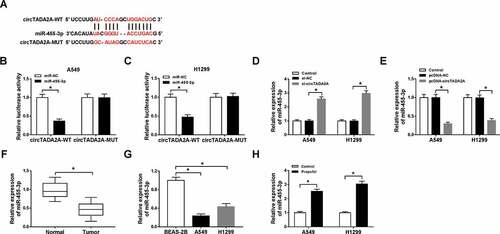
Figure 5. Propofol performs anti-tumor effects by regulating circTADA2A/miR-455-3p axis in lung cancer cells. A549 and H1299 cells were transfected with pcDNA-NC, pcDNA-circTADA2A, pcDNA-circTADA2A + miR-NC, or pcDNA-circTADA2A + miR-455-3p before propofol treatment. (a) The transfection efficiency was analyzed using qRT-PCR. (b,c) Cell proliferation was analyzed using CCK-8 and BrdU assay. (d,e) Cell migration and invasion were detected by transwell assay. (f,g) The glucose consumption and lactate production were examined with a glucose and lactate assay kit. (h) Seahorse XF24 Extracellular Flux Analyzer was applied to measure extracellular acidification. (i,j) The levels of GLUT1, PKM2, HK2, and LDHA protein in A549 and H1299 cells were examined by western blot. *P < 0.05.
Figure 6. MiR-455-3p is a target of FOXM1 in lung cancer cells. (a) The potential binding sites between FOXM1 and miR-455-3p were predicted through searching StarBase3.0 program. (b,c) Luciferase activity of A549 and H1299 cells co-transfected with FOXM1 3’UTR-WT or FOXM1 3’UTR-MUT and miR-455-3p mimics or miR-NC was determined by dual-luciferase reporter assay. (dg) The expression of FOXM1 in lung cancer tumor tissues and normal tissues, as well as lung cancer cell lines and normal BEAS-2B cell line was measured using qRT-PCR and western blot. (h,i) The level of FOXM1 was examined using qRT-PCR and western blot in A549 and H1299 cells treated with propofol. (j,k) The level of FOXM1 was examined using qRT-PCR and western blot in A549 and H1299 cells transfected with anti-miR-NC, anti-miR-455-3p, anti-miR-455-3p + si-NC, anti-miR-455-3p + si-FOXM1. *P < 0.05.
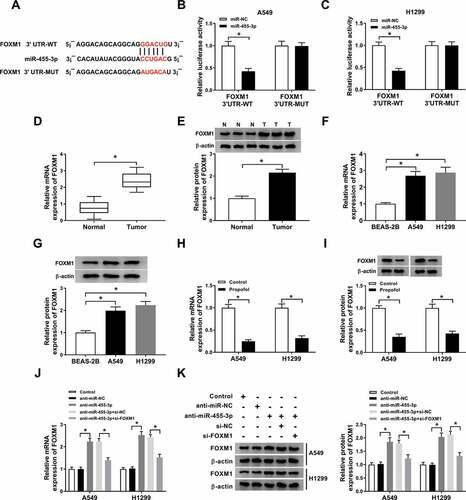
Figure 7. Propofol inhibits cell tumorigenesis and aerobic glycolysis by regulating miR-455-3p/FOXM1 axis in lung cancer. A549 and H1299 cells transfected with anti-miR-NC, anti-miR-455-3p, anti-miR-455-3p + si-NC, anti-miR-455-3p + si-FOXM1 before propofol treatment. (a,b) The analysis of A549 and H1299 cell proliferation was conducted by CCK-8 and BrdU assay. (c,d) The migrated and invaded A549 and H1299 cells were measured using transwell assay. (e,f) The glucose consumption and lactate production were examined with a glucose and lactate assay kit. (g) Extracellular acidification measurements were carried out by Seahorse XF24 Extracellular Flux Analyzer. (h,i) Western blot analysis of GLUT1, PKM2, HK2, and LDHA protein in A549 and H1299 cells was conducted. *P < 0.05.

Figure 8. CircTADA2A indirectly regulates FOXM1 expression by binding to miR-455-3p in lung cancer cells. A549 and H1299 cells were transfected with miR-NC, miR-455-3p, miR-455-3p + pcDNA-NC, pcDNA-circTADA2A. (a,b) The protein and mRNA expression of FOXM1 was detected using qRT-PCR and western blot. P < 0.05.
Figure 9. Propofol inhibits tumor growth in vivo. (a) Tumor volume was measured every 3 days. (b) Tumor weight was measured on day 21. (c-f) The expression of circTADA2A, miR-455-3p and FOXM1 were determined using qRT-PCR or western blot. *P < 0.05.
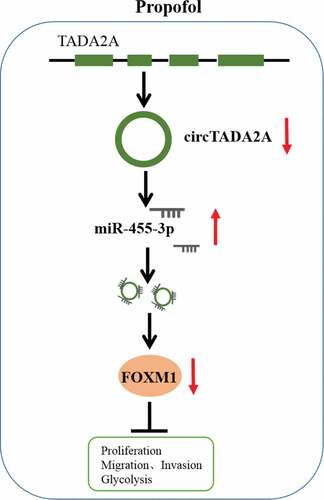
Figure 10. The schematic diagram of propofol and circTADA2A/miR-455-3p/FOXM1 axis in lung cancer. Propofol inhibits cell carcinogenesis and aerobic glycolysis in lung cancer via circTADA2A/miR-455-3p/FOXM1 axis.
Availability of data and materials
The analyzed data sets generated during the present study are available from the corresponding author on reasonable request.