
Figures & data
Figure 1. Impact of melatonin on HK-2 cell antioxidant capacity and viability. Cells in each group were treated for 12 h with 4 mmol/L Ox (except the NC group). Comparisons of (a) cell viability, (b) LDH content, (c) MDA content, (d) T-AOC content, (e) GSH content, (f) SOD content, and (g) CAT content. Data are presented as the means ± SEM from three independent experiments. *P < 0.05, **P < 0.01, ***P < 0.001,****P < 0.0001, versus the NC group; #P < 0.05, ##P < 0.01, ###P < 0.001, ####P < 0.0001, versus the Ox group
Figure 2. Impact of melatonin on ROS production and apoptosis in HK-2 cells. Cells in the respective groups were treated for 12 h with 4 mmol/L Ox (except the NC group) and 10 μmol/L MLT (Ox + MLT group only). Flow cytometry profiles and corresponding histograms showing (a) ROS levels and (b) early and late apoptotic rate in three treatment groups. Immunofluorescence images showing (c) mitochondrial membrane potential and (d) caspase-3 activity (200× magnification), and (e) histogram of ELISA showing caspase-3 activity. The reduction in mitochondrial membrane potential (transition from red to green fluorescence) is a sign of early apoptosis. Stronger green fluorescence indicates higher caspase-3 activity. Data are presented as the means ± SEM from three independent experiments. *P < 0.05, **P < 0.01, ***P < 0.001,****P < 0.0001 versus the NC group; #P < 0.05, ##P < 0.01, ###P < 0.001, ####P < 0.0001 versus the Ox group
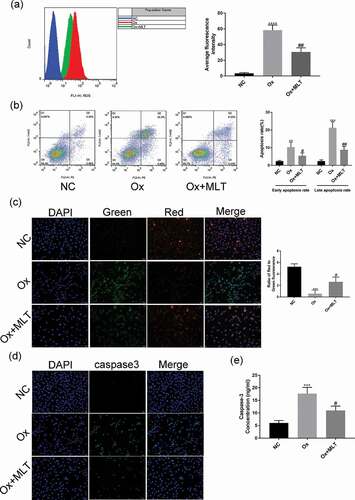
Figure 3. Impact of melatonin on ER stress-related protein and mRNA levels. Cells in each group were treated for 12 h with 4 mmol/L Ox (except the NC group) and 10 μmol/L MLT (except NC and Ox groups). (a) RT-PCR histograms of mRNA levels of DDIT3, GRP78, ATF6, and XBP1s relative to GAPDH. (b) Western blot and corresponding histograms of DDIT3, GRP78, ATF6, PERK, p-PERK, IRE1, p-IRE1, and XBP1s protein expression relative to GAPDH. Data are presented as the mean ± SEM from three experiments. *P < 0.05, **P < 0.01, ***P < 0.001, ****P < 0.0001 versus the NC group; #P < 0.05, ##P < 0.01, ###P < 0.001, ####P < 0.0001 versus the Ox group
Figure 4. Impact of melatonin on expression of AMPK and apoptotic proteins. Cells in each group were treated with 4 mmol/L of Ox for 12 h (except the NC group). Western blot and corresponding histograms of protein expression levels of caspase-12, cleaved caspase-3, cleaved caspase-9, p-AMPK, and AMPK relative to GAPDH. Data are presented as the mean ± SEM from three independent experiments. *P < 0.05, **P < 0.01, ***P < 0.001, ****P < 0.0001 versus the NC group; #P < 0.05, ##P < 0.01, ###P < 0.001, ####P < 0.0001 versus the Ox group; ns: not significant
Figure 5. Effect of AMPK inhibition on melatonin-mediated regulation of apoptosis and mitochondrial membrane potential. Cells in each group were treated for 12 h with 4 mmol/L Ox, 10 µmol/L MLT, and/or 5 µmol/L Cpd C 2HCl. (a) Flow cytometry was used to detect HK-2 cell apoptosis. (b) Immunofluorescence of Mito-Tracker Red CMXRos-staining (red) (200× magnification) to determine HK-2 cell mitochondrial membrane potential of the respective groups, (c) Immunofluorescence of JC-1 (200× magnification) to determine HK-2 cell mitochondrial membrane potential in the respective groups, (d) ELISA showing caspase-3 activity. Stronger red fluorescence signal correlates with higher mitochondrial membrane potential. Data are presented as the mean ± SEM from three independent experiments. *P < 0.05, **P < 0.01, ***P < 0.001, ****P < 0.0001 versus the NC group; #P < 0.05, ##P < 0.01, ###P < 0.001, ####P < 0.0001 versus the Ox group; ^P < 0.05, ^^P < 0.01, ^^^P < 0.001, ^^^^P < 0.0001 versus the Ox + MLT group
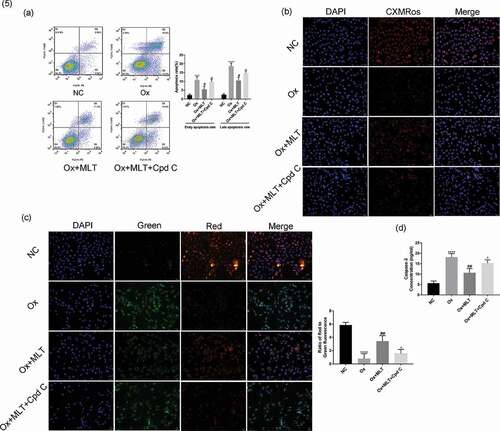
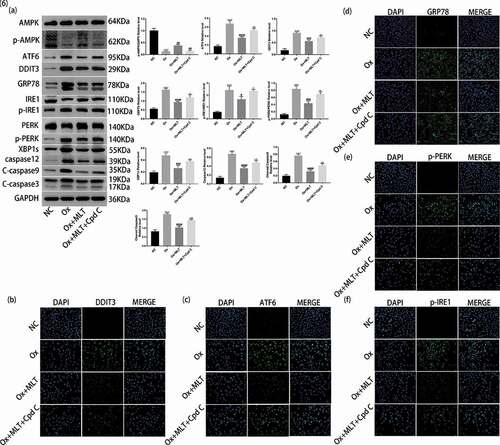
Figure 6. Role of AMPK activation on melatonin-mediated inhibition of ER stress. Cells in each group were treated for 12 h with 4 mmol/L Ox, 10 μmol/L MLT, and/or 5 μmol/L Cpd C 2HCl. (a) Western blot and corresponding histograms of DDIT3, GRP78, ATF6, PERK, p-PERK, IRE1, p-IRE1, XBP1s, caspase-12, cleaved caspase-3, cleaved caspase-9, p-AMPK, and AMPK protein expression relative to GAPDH. Immunofluorescence detection of (b) DDIT3, (c) ATF6, (d) GRP78, (e) p-PERK and (f) p-IRE1 protein expression (200× magnification). Anti-rabbit IgG (H + L), F (ab’) 2 Fragment (Alexa Fluor® 488 Conjugate) output green fluorescence. Data are presented as the mean ± SEM from three independent experiments. *P < 0.05, **P < 0.01, ***P < 0.001, ****P < 0.0001 versus the NC group; #P < 0.05, ##P < 0.01, ###P < 0.001, ####P < 0.0001 versus the Ox group; ^P < 0.05, ^^P < 0.01, ^^^P < 0.001, ^^^^P < 0.0001 versus the Ox + MLT group; ns: not significant
Data availability statement
The original data is available upon reasonable request.