Figures & data
Table 1. Association of WT1 with the clinicopathological characteristics of ovarian cancer
Figure 1. Clinical significance of WT1 in human ovarian cancer. A, Box plots of WT1 mRNA levels in OC tissues and normal ovarian tissues in the Oncomine cancer microarray database. B, Kaplan-Meier curves of progression-free survival (PFS) probability in OC patients with high levels of WT1 expression (red) as compared to those with low WT1 expression levels (black). C, The mRNA expression of WT1 in OC tissues and their matched non-tumor counterparts in the 49 patients. ** P < 0.01. D, Representative images of immunohistochemistry staining for WT1 in OC tissues and their paired non-tumor tissues. Magnification x 10. Bar = 20 μm. E, A linear correlation study was performed between mRNA expression of WT1 vs. E-cadherin in OC tissues of the 49 patients
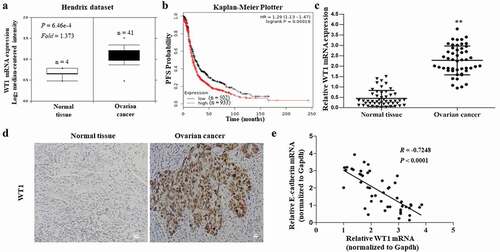
Figure 2. WT1 knockdown and overexpression in ovarian cancer cell lines. (a,b) WT1 expression in four ovarian cancer cell lines (SKOV3, A2780, HO8910, HO8910PM) and normal human ovarian cell line (IOSE386) was examined using qRT-PCR and western blot assay. GAPDH used as loading control. ** P < 0.01 represents difference in SKOV3 and HO8910PM cell lines compared with IOSE386, respectively. (c,d) The knockdown efficiency of WT1 was detected by qRT-PCR and western blotting in SKOV3 and HO8910PM cells. GAPDH served as loading control. (e) The overexpression efficiency of WT1 was examined by western blotting in A2780 cells. The graph on the right of figures B and D, or lower panel of figure E showed the quantification of the results. The data were presented as the mean ± SD from three experimental replicates. **P < 0.01 compared with the compared group
Figure 3. WT1 enhances cell migration and invasion in ovarian cancer. (a,c) Representative images of wound-healing assay with WT1 knockdown in SKOV3 and HO8910PM cells or WT1 overexpression in A2780 cells. (b,d) Transwell assay showing that the invasive ability of SKOV3 and HO8910PM cells was significantly suppressed after WT1 silencing and WT1 overexpression promoted the invasion capacity of A2780 cells. The right panel showed the quantitative results. The data were presented as the mean ± SD from three experimental replicates. *P < 0.05, **P < 0.01
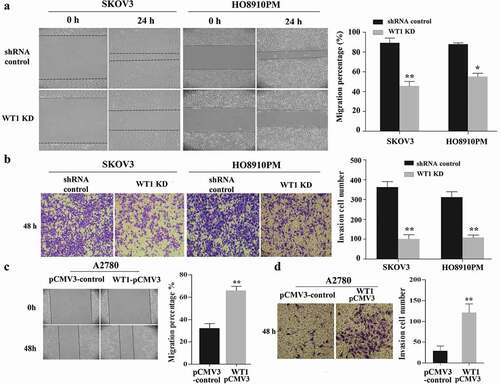
Figure 4. Silencing WT1 reverses EMT in ovarian cancer cells and correlates with an increase in E-cadherin expression. (a,b) qRT-PCR and western blot were used to detect changes in the mRNA and protein expression of EMT-associated genes in WT1 knockdown SKOV3 and HO8910PM cells. (c) ChIP-qPCR analysis of WT1 binding at E-cadherin proximal promoter region at the −146 bp upstream of the transcription start site in SKOV3 cells. Data were normalized to the percent of Input. (d) Luciferase activity of reporter construct carrying E-cadherin promoter in SKOV3 cells in the presence of indicated amounts of WT1 expression vector to test the effect of WT1 on E-cadherin promoter. E, Luciferase activity of wild type or mutant E-cadherin proximal promoter containing a mutated −146 WT1 binding site with pCMV3-WT1 or pCMV3. Luciferase activity was measured and normalized to protein concentration. Data are reported relative to luciferase activity of pCMV3 transfected cells. The data were presented as the mean ± SD from three experimental replicates. * indicated P < 0.05; ** indicated P < 0.01
Figure 5. WT1 promotes EMT through ERK1/2 phosphorylation. (a) Western blotting to detect p-Akt, Akt, p-RPS6, RPS6, p-ERK1/2, ERK1/2 and E-cadherin expression in WT1 knockdown and shRNA control SKOV3 cells. (b) Overexpression of WT1 obviously changed the expression levels of E-cadherin and p-ERK1/2 in a dose-dependent manner. (c) The protein expression of E-cadherin and p-ERK1/2 was determined in WT1-overexpressed A2780 cells treated with U0126. (d,f) Wound healing and transwell assays were performed to detect the migration and invasion capacity of A2780 cells treated with pCMV3 vector and different concentrations (0 μM, 10 μM, 20 μM) of U0126 after the de novo expression of WT1 separately. The panel on the right of figures A, B, D, E or lower panel of figure C showed the quantification of the results. The data were presented as the mean ±SD from three experimental replicates. *P < 0.05; ** P < 0.01
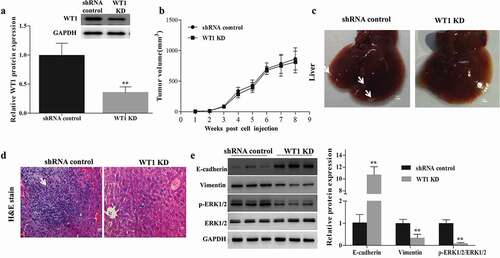
Figure 6. WT1 depletion reduces SKOV3 cells metastasis in vivo. (a) Western blotting was performed to confirm the knockdown efficiency of WT1 in established tumors. (b) Tumor growth curves were summarized in the line chart. (c) Image of metastatic liver nodules spreading throughout the live tissues in mice injected with shRNA control SKOV3 cells. WT1 knockdown clearly abolished the metastasis. White arrows indicated tumor foci. Bar = 1 mm. (d) Hematoxylin and eosin (H&E) staining was used to visualize the metastatic nodules in tumors from mice injected with shRNA control SKOV3 cells. The arrow indicated tumor foci. Magnification x 20. Bar = 50 μm. E, Western blot was performed to detect changes in the protein expression of EMT-associated genes proteins and ERK1/2 activation in the xenograft mouse primary tumors from the mice inoculated with WT1 KD cells compared to the controls. The lower panel of figure A or the panel on the right of figure E showed the quantification of the results. ** P < 0.01