Figures & data
Table 1. Primer sequences for RT-qPCR
Table 2. The PC-related biological processes
Table 3. Binding of miRs and DAB1
Figure 1. Bioinformatics reveals that Hsa-miR-300 affects PC progression by interacting with DAB1.
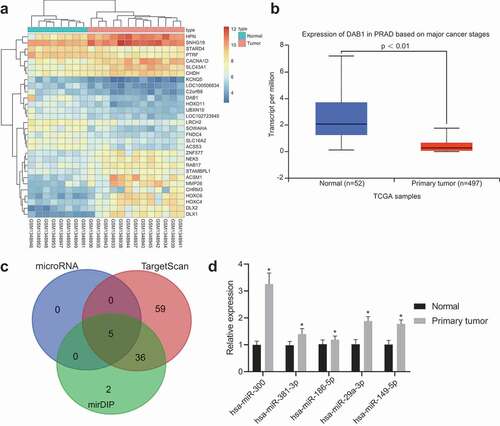
Figure 2. miR-300 targets DAB1 and exhibits an important role in the progression of PC tissues indicated by dual-luciferase reporter gene assay, immunohistochemistry, and RT-qPCR
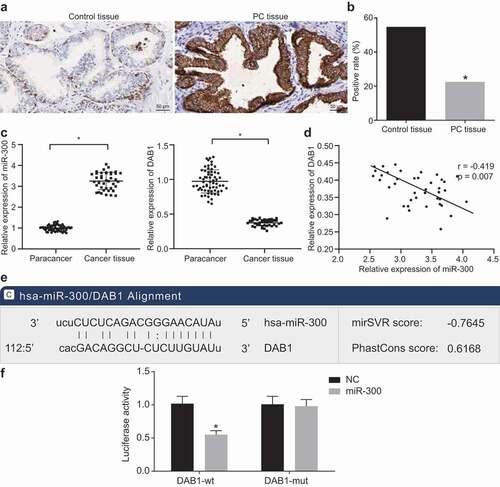
Table 4. The relationship between miR-200 and pathological characteristics of patients with PC
Figure 3. RT-qPCR and Western blot analysis reveals that down-regulated miR-300 reduces the expression of RAC1, MMP2, MMP9, CyclinD1, and CyclinE, but elevate the level of DAB1 and Rap1
Figure 4. Down-regulated miR-300 decreases the adhesion of PC cells by targeting DAB1.
Figure 5. MTT and EdU assay reveals that the up-regulation of miR-300 or DAB1 silencing can enhance cell proliferation, while inhibition of miR-300 suppresses the proliferation of PC cells
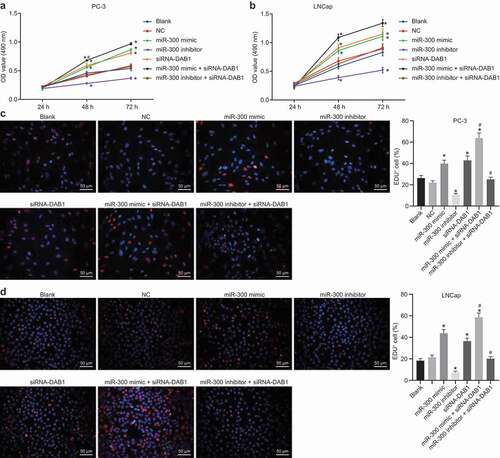
Figure 6. Scratch test indicates that down-regulated miR-300 suppresses the migration of PC cells upon treatment with miR-300 mimic/inhibitor and/or siRNA-DAB1.
Figure 7. Transwell assay reveals that down-regulated of miR-300 reduces the invasion of PC cells by up-regulating DAB1.
Figure 8. Flow cytometry assay revealed that down-regulated miR-300 reduces cell cycle and promotes apoptosis by up-regulating DAB1 expression
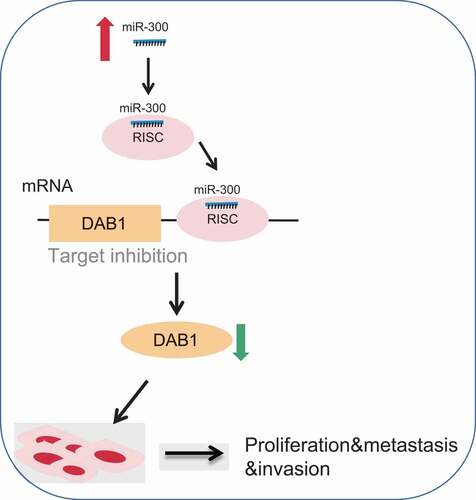
Figure 9. The molecular mechanism involved miR-300 targeting DAB1 in PC. MiR-300 inhibited the expression of DAB1 so that the expression of RAC1, MMP2, MMP9, CyclinD1, and CyclinE was increased. Down-regulated miR-300 suppressed proliferation, adhesion, migration, invasion, and cell cycle, but promoted apoptosis of PC cells. While down-regulation of miR-300 could reverse the above tendency and provided a therapeutic target for PC