813
Views
14
CrossRef citations to date
0
Altmetric
Research Paper

Circular RNA hsa_circ_0001785 inhibits the proliferation, migration and invasion of breast cancer cells in vitro and in vivo by sponging miR-942 to upregulate SOCS3

ORCID Icon, , , , , , , & show all
Pages 2811-2825 | Received 13 May 2020, Accepted 26 Aug 2020, Published online: 15 Oct 2020

Figures & data

Figure 1. Circ_0001785 is lowly expressed and circ_0001785 overexpression inhibits the breast cancer cell proliferation. (a) Circ_0001785 expression in various breast cancer cell lines. ***p < 0.001 vs. MCF-10A. (b) The transfection efficiency of circ_0001785 overexpressed plasmid was measured by qRT-PCR. ***p < 0.001 vs. pcDNA-NC. (c) The effect of circ_0001785 overexpression on T47D and MDA-MB-231 cells proliferation was measured by CCK-8 assay at 24, 48 and 72 h. ***p < 0.001 vs. pcDNA-NC. (d-e) Colony formation assay was performed to determine the effect of circ_0001785 overexpression on the proliferation abilities of T47D and MDA-MB-231 cells. ***p < 0.001 vs. pcDNA-NC
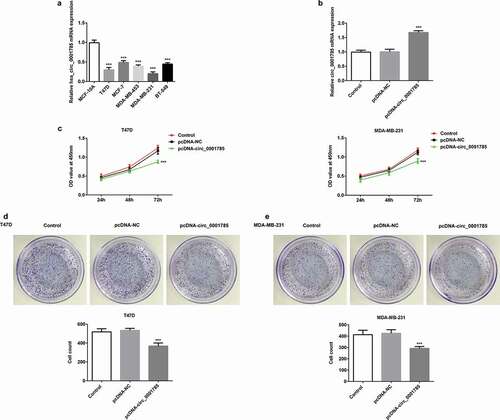
Figure 1. Circ_0001785 is lowly expressed and circ_0001785 overexpression inhibits the breast cancer cell proliferation. (a) Circ_0001785 expression in various breast cancer cell lines. ***p < 0.001 vs. MCF-10A. (b) The transfection efficiency of circ_0001785 overexpressed plasmid was measured by qRT-PCR. ***p < 0.001 vs. pcDNA-NC. (c) The effect of circ_0001785 overexpression on T47D and MDA-MB-231 cells proliferation was measured by CCK-8 assay at 24, 48 and 72 h. ***p < 0.001 vs. pcDNA-NC. (d-e) Colony formation assay was performed to determine the effect of circ_0001785 overexpression on the proliferation abilities of T47D and MDA-MB-231 cells. ***p < 0.001 vs. pcDNA-NC

Figure 2. Circ_0001785 overexpression inhibits the breast cancer cell migration and invasion. (a-b) The representative pictures of T47D cell migration and invasion. (c) Effect of circ_0001785 overexpression on cell migration and invasion in T47D cells. (d-e) The representative pictures of MDA-MB-231 cell migration and invasion assays. (f) Effect of circ_0001785 overexpression on cell migration and invasion in MDA-MB-231 cells. (g-h) Effect of circ_0001785 overexpression on MMP7 and MMP9 expressions in T47D and MDA-MB-231 cells. GAPDH was used as a loading control. **p < 0.01 and ***p < 0.001 vs. pcDNA-NC
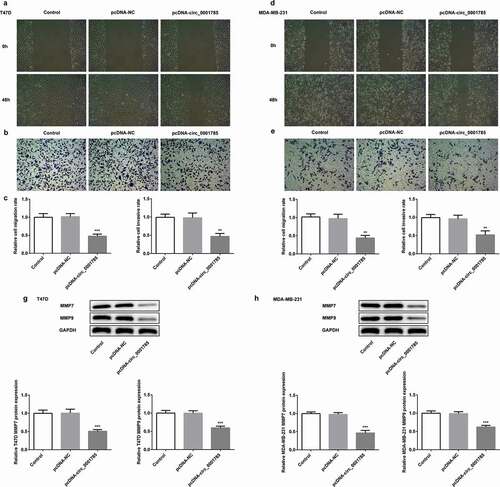
Figure 2. Circ_0001785 overexpression inhibits the breast cancer cell migration and invasion. (a-b) The representative pictures of T47D cell migration and invasion. (c) Effect of circ_0001785 overexpression on cell migration and invasion in T47D cells. (d-e) The representative pictures of MDA-MB-231 cell migration and invasion assays. (f) Effect of circ_0001785 overexpression on cell migration and invasion in MDA-MB-231 cells. (g-h) Effect of circ_0001785 overexpression on MMP7 and MMP9 expressions in T47D and MDA-MB-231 cells. GAPDH was used as a loading control. **p < 0.01 and ***p < 0.001 vs. pcDNA-NC

Figure 3. Circ_0001785 inhibits breast cancer progression in vivo. (a) The circ_0001785 overexpression and control T47D cells were inoculated in nude mice, and mouse weight and tumor volume were monitored every day. (b) Tumor mass of T47D tumor xenograft-induced nude mice after 14 d of treatment. (c) The circ_0001785 overexpression and control MDA-MB-231 cells were inoculated in nude mice, and mouse weight and tumor volume were monitored every day. (d) Tumor mass of MDA-MB-231 tumor xenograft-induced nude mice after 14 d of treatment. (e-f) Expressions of KI67, PCNA, MMP7 and MMP9 in tumor tissues inoculated with T47D cells were detected by western blot analysis. GAPDH was used as the loading control. (g-h) Expressions of KI67, PCNA, MMP7 and MMP9 in tumor tissues inoculated with MDA-MB-231 cells were detected by western blot analysis. GAPDH was used as the loading control. **p < 0.01 and ***p < 0.001 vs. Mock
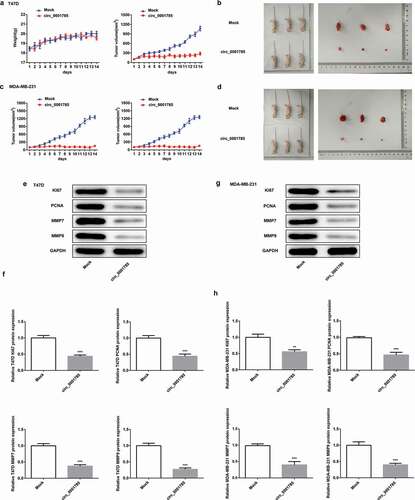
Figure 3. Circ_0001785 inhibits breast cancer progression in vivo. (a) The circ_0001785 overexpression and control T47D cells were inoculated in nude mice, and mouse weight and tumor volume were monitored every day. (b) Tumor mass of T47D tumor xenograft-induced nude mice after 14 d of treatment. (c) The circ_0001785 overexpression and control MDA-MB-231 cells were inoculated in nude mice, and mouse weight and tumor volume were monitored every day. (d) Tumor mass of MDA-MB-231 tumor xenograft-induced nude mice after 14 d of treatment. (e-f) Expressions of KI67, PCNA, MMP7 and MMP9 in tumor tissues inoculated with T47D cells were detected by western blot analysis. GAPDH was used as the loading control. (g-h) Expressions of KI67, PCNA, MMP7 and MMP9 in tumor tissues inoculated with MDA-MB-231 cells were detected by western blot analysis. GAPDH was used as the loading control. **p < 0.01 and ***p < 0.001 vs. Mock

Figure 4. Circ_0001785 serves as a ceRNA via sponging miR-942 in breast cancer. (a) Expressions of circ_0001785, U6 and GAPDH were detected. (b) Circ_0001785 target genes predicted using CircInteractome and five miRNAs (miR-1200, miR-1251, miR-605, miR-610, miR-942) were screened. (c) Dual-luciferase reporter gene assay in T47D and MDA-MB-231 cells cotransfected with wild-type/mutant-type circ_0001785 and five predicted miRNAs mimics/negative control. ***p < 0.001 vs. miR-NC. (d) Expressions of five miRNAs in T47D and MDA-MB-231 cells were examined by western blot analysis. ***p < 0.001 vs. miR-1200. (e) Effect of Circ_0001785 overexpression on the expression of miR-942 in T47D and MDA-MB-231 cells transfected with empty vector or circ_0001785 overexpression plasmid by qRT-PCR. ***p < 0.001 vs. pcDNA-NC. (f) MiR-942 expression levels in tumor tissues transfected with empty vector or circ_0001785 overexpression plasmid by qRT-PCR. ***p < 0.001 vs. pcDNA-NC. (g) RIP assay was performed to confirm the direct binding between circ_0001785 and miR-942. ***p < 0.001 vs. MS2bs-circ_0001785
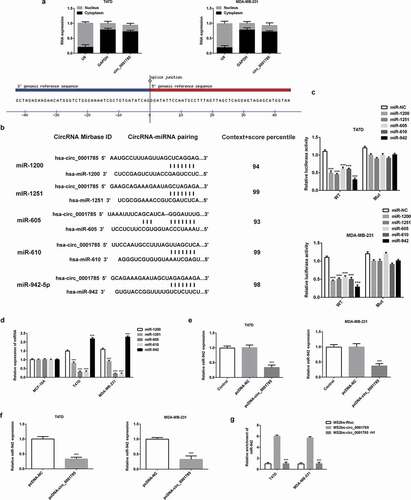
Figure 4. Circ_0001785 serves as a ceRNA via sponging miR-942 in breast cancer. (a) Expressions of circ_0001785, U6 and GAPDH were detected. (b) Circ_0001785 target genes predicted using CircInteractome and five miRNAs (miR-1200, miR-1251, miR-605, miR-610, miR-942) were screened. (c) Dual-luciferase reporter gene assay in T47D and MDA-MB-231 cells cotransfected with wild-type/mutant-type circ_0001785 and five predicted miRNAs mimics/negative control. ***p < 0.001 vs. miR-NC. (d) Expressions of five miRNAs in T47D and MDA-MB-231 cells were examined by western blot analysis. ***p < 0.001 vs. miR-1200. (e) Effect of Circ_0001785 overexpression on the expression of miR-942 in T47D and MDA-MB-231 cells transfected with empty vector or circ_0001785 overexpression plasmid by qRT-PCR. ***p < 0.001 vs. pcDNA-NC. (f) MiR-942 expression levels in tumor tissues transfected with empty vector or circ_0001785 overexpression plasmid by qRT-PCR. ***p < 0.001 vs. pcDNA-NC. (g) RIP assay was performed to confirm the direct binding between circ_0001785 and miR-942. ***p < 0.001 vs. MS2bs-circ_0001785

Figure 5. Circ_0001785 regulated the breast cancer cell proliferation by targeting miR-942. (a) The transfection efficiencies of miR-942 overexpression and knockdown were measured by qRT-PCR. ***p < 0.001 vs. miR-NC. (b) The effect of miR-942 overexpression and knockdown on T47D and MDA-MB-231 cells proliferation were measured by CCK-8 assay at 24, 48 and 72 h. **p < 0.01 and ***p < 0.001 vs. pcDNA-circ_0001785+ miR-NC. (c-d) Colony formation assay was performed to determine the effect of miR-942 overexpression and knockdown on the proliferation abilities of T47D and MDA-MB-231 cells. **p < 0.01 and ***p < 0.001 vs. pcDNA-circ_0001785+ miR-NC
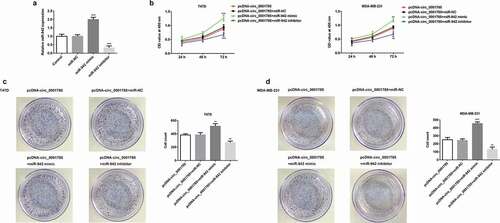
Figure 5. Circ_0001785 regulated the breast cancer cell proliferation by targeting miR-942. (a) The transfection efficiencies of miR-942 overexpression and knockdown were measured by qRT-PCR. ***p < 0.001 vs. miR-NC. (b) The effect of miR-942 overexpression and knockdown on T47D and MDA-MB-231 cells proliferation were measured by CCK-8 assay at 24, 48 and 72 h. **p < 0.01 and ***p < 0.001 vs. pcDNA-circ_0001785+ miR-NC. (c-d) Colony formation assay was performed to determine the effect of miR-942 overexpression and knockdown on the proliferation abilities of T47D and MDA-MB-231 cells. **p < 0.01 and ***p < 0.001 vs. pcDNA-circ_0001785+ miR-NC

Figure 6. Circ_0001785 regulated the breast cancer cell migration and invasion by targeting miR-942. (a-b) The representative pictures of T47D cell migration and invasion. (c) Effect of miR-942 overexpression and knockdown on cell migration and invasion in T47D cells. (d-e) The representative pictures of MDA-MB-231 cell migration and invasion assays. (f) Effect of miR-942 overexpression and knockdown on cell migration and invasion in MDA-MB-231 cells. (g-h) Effect of miR-942 overexpression and knockdown on MMP7 and MMP9 expressions in T47D and MDA-MB-231 cells. GAPDH was used as a loading control. *p < 0.05, **p < 0.01 and ***p < 0.001 vs. pcDNA-circ_0001785+ miR-NC
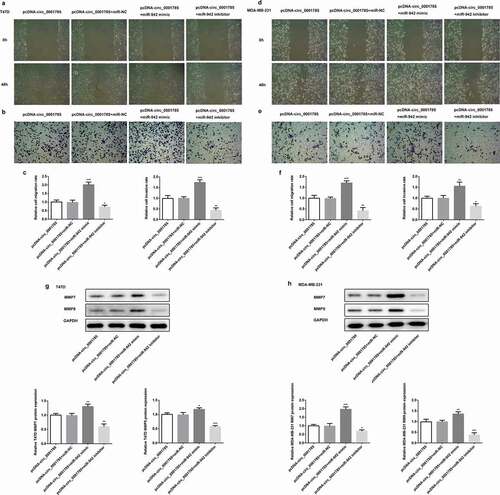
Figure 6. Circ_0001785 regulated the breast cancer cell migration and invasion by targeting miR-942. (a-b) The representative pictures of T47D cell migration and invasion. (c) Effect of miR-942 overexpression and knockdown on cell migration and invasion in T47D cells. (d-e) The representative pictures of MDA-MB-231 cell migration and invasion assays. (f) Effect of miR-942 overexpression and knockdown on cell migration and invasion in MDA-MB-231 cells. (g-h) Effect of miR-942 overexpression and knockdown on MMP7 and MMP9 expressions in T47D and MDA-MB-231 cells. GAPDH was used as a loading control. *p < 0.05, **p < 0.01 and ***p < 0.001 vs. pcDNA-circ_0001785+ miR-NC

Figure 7. Circ_0001785 inhibits breast cancer progression in vivo by targeting miR-942. (a) The miR-942 mimic and control T47D cells were inoculated in nude mice, and mouse weight and tumor volume were monitored every day. (b) Tumor mass of T47D tumor xenograft-induced nude mice after 14 days of treatment. (c) The miR-942 mimic and control MDA-MB-231 cells were inoculated in nude mice, and mouse weight and tumor volume were monitored every day. (d) Tumor mass of MDA-MB-231 tumor xenograft-induced nude mice after 14 d of treatment. (e-f) Expressions of KI67, PCNA, MMP7 and MMP9 in tumor tissues inoculated with T47D cells were detected by western blot analysis. GAPDH was used as the loading control. (g-h) Expressions of KI67, PCNA, MMP7 and MMP9 in tumor tissues inoculated with MDA-MB-231 cells were detected by western blot analysis. GAPDH was used as the loading control. **p < 0.01 and ***p < 0.001 vs. circ_0001785+ NC
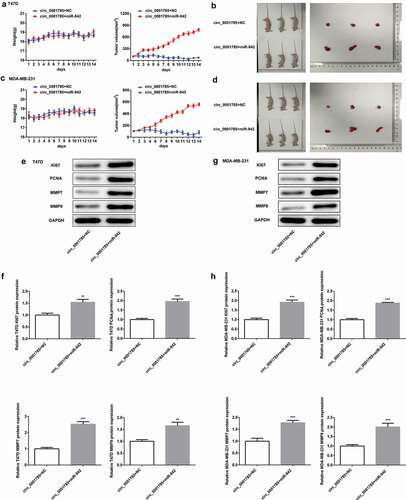
Figure 7. Circ_0001785 inhibits breast cancer progression in vivo by targeting miR-942. (a) The miR-942 mimic and control T47D cells were inoculated in nude mice, and mouse weight and tumor volume were monitored every day. (b) Tumor mass of T47D tumor xenograft-induced nude mice after 14 days of treatment. (c) The miR-942 mimic and control MDA-MB-231 cells were inoculated in nude mice, and mouse weight and tumor volume were monitored every day. (d) Tumor mass of MDA-MB-231 tumor xenograft-induced nude mice after 14 d of treatment. (e-f) Expressions of KI67, PCNA, MMP7 and MMP9 in tumor tissues inoculated with T47D cells were detected by western blot analysis. GAPDH was used as the loading control. (g-h) Expressions of KI67, PCNA, MMP7 and MMP9 in tumor tissues inoculated with MDA-MB-231 cells were detected by western blot analysis. GAPDH was used as the loading control. **p < 0.01 and ***p < 0.001 vs. circ_0001785+ NC

Figure 8. SOCS3 is a target gene of miR-942. (a) TargetScan predicted that SOCS3 was a target gene of miR-942. (b) The expressions of SOCS3 in T47D and MDA-MB-231 cells were detected by qRT-PCR. ***p < 0.001 vs. MCF-10A. (c) The expression of SOCS3 in T47D and MDA-MB-231 cells were detected by western blot analysis. **p < 0.01 and ***p < 0.001 vs. MCF-10A. (d) The relationship between miR-942-5p and SOCS3 was determined by a dual-luciferase reporter assay. **p < 0.01 vs. SOCS3+ miR-NC mimic
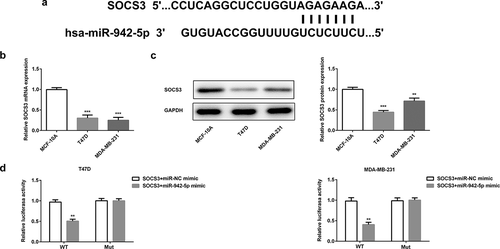
Figure 8. SOCS3 is a target gene of miR-942. (a) TargetScan predicted that SOCS3 was a target gene of miR-942. (b) The expressions of SOCS3 in T47D and MDA-MB-231 cells were detected by qRT-PCR. ***p < 0.001 vs. MCF-10A. (c) The expression of SOCS3 in T47D and MDA-MB-231 cells were detected by western blot analysis. **p < 0.01 and ***p < 0.001 vs. MCF-10A. (d) The relationship between miR-942-5p and SOCS3 was determined by a dual-luciferase reporter assay. **p < 0.01 vs. SOCS3+ miR-NC mimic

Figure 9. Circ_0001785 regulates SOCS3 expression via inhibiting miR-942. (a) The expressions of SOCS3 in breast cancer cells transfected with miR-942 overexpression plasmid and circ_0001785 overexpression vector were detected by qRT-PCR. ***p < 0.001 vs. miR-NC mimic; ###p < 0.001 vs. pcDNA-NC. (b) The expressions of SOCS3 in breast cancer cells transfected with miR-942 overexpression plasmid and circ_0001785 overexpression vector were detected by western blot analysis. ***p < 0.001 vs. miR-NC mimic; ###p < 0.001 vs. pcDNA-NC. (c) RIP assay revealed the enrichment of circ_0001785, miR-942 and SOCS3 on Ago2. ***p < 0.001 vs. Anti-IgG. (d) Expressions of SOCS3 in T47D and MDA-MB-231 cells were detected by western blot analysis. **p < 0.01 and ***p < 0.001 vs. pcDNA-circ_0001785. (e) Expressions of SOCS3 in tumor tissue from mice were detected by western blot analysis. **p < 0.01 and ***p < 0.001 vs. circ_0001785+ NC
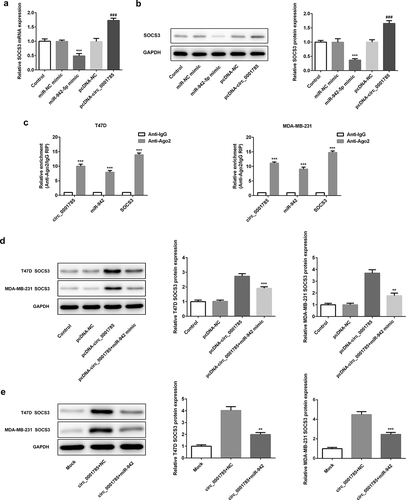
Figure 9. Circ_0001785 regulates SOCS3 expression via inhibiting miR-942. (a) The expressions of SOCS3 in breast cancer cells transfected with miR-942 overexpression plasmid and circ_0001785 overexpression vector were detected by qRT-PCR. ***p < 0.001 vs. miR-NC mimic; ###p < 0.001 vs. pcDNA-NC. (b) The expressions of SOCS3 in breast cancer cells transfected with miR-942 overexpression plasmid and circ_0001785 overexpression vector were detected by western blot analysis. ***p < 0.001 vs. miR-NC mimic; ###p < 0.001 vs. pcDNA-NC. (c) RIP assay revealed the enrichment of circ_0001785, miR-942 and SOCS3 on Ago2. ***p < 0.001 vs. Anti-IgG. (d) Expressions of SOCS3 in T47D and MDA-MB-231 cells were detected by western blot analysis. **p < 0.01 and ***p < 0.001 vs. pcDNA-circ_0001785. (e) Expressions of SOCS3 in tumor tissue from mice were detected by western blot analysis. **p < 0.01 and ***p < 0.001 vs. circ_0001785+ NC

Reprints and Corporate Permissions

Please note: Selecting permissions does not provide access to the full text of the article, please see our help page How do I view content?

To request a reprint or corporate permissions for this article, please click on the relevant link below:

Academic Permissions

Please note: Selecting permissions does not provide access to the full text of the article, please see our help page How do I view content?

Obtain permissions instantly via Rightslink by clicking on the button below:

If you are unable to obtain permissions via Rightslink, please complete and submit this Permissions form. For more information, please visit our Permissions help page.